



Natural Gas Futures Remains Under Pressure
The U.S. Energy Information Administration (EIA) said the storage of natural gas increased by 65 billion cubic feet to 3,077 billion cubic feet for the week ended June 26. The total working gas storage increased by 30.1% from last year....
Share this:

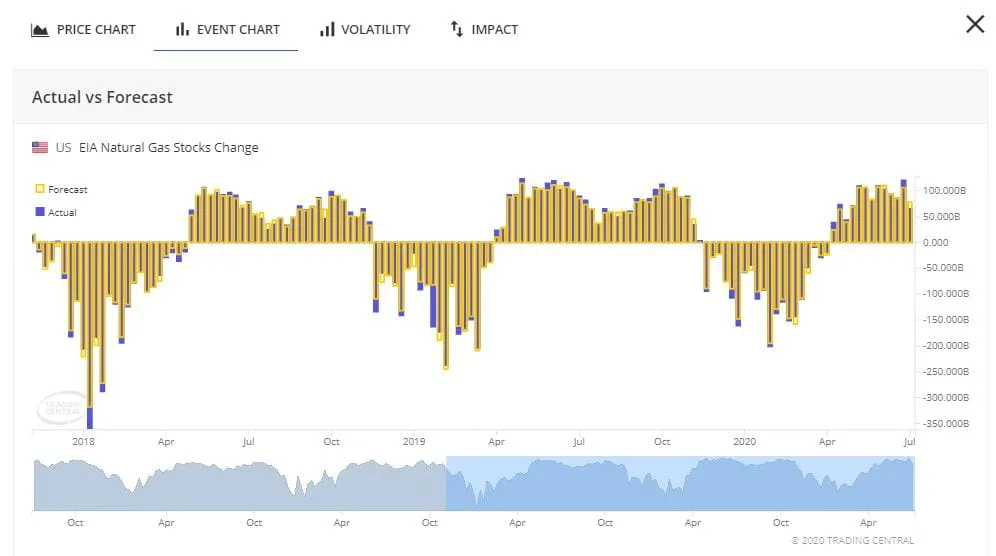
The U.S. Energy Information Administration (EIA) said the storage of natural gas increased by 65 billion cubic feet to 3,077 billion cubic feet for the week ended June 26. The total working gas storage increased by 30.1% from last year.
Source: Trading Economic
In the above chart, the natural gas storage storage is increasing after April. In fact, there would be a seasonal cycle to build the stockpile during April to November. Therefore, it would expect the continuation of increasing the natural gas storage.
The International Energy Agency estimated that the global consumption of natural gas would drop by 4% this year, or twice amount lost after the 2008 global financial crisis.
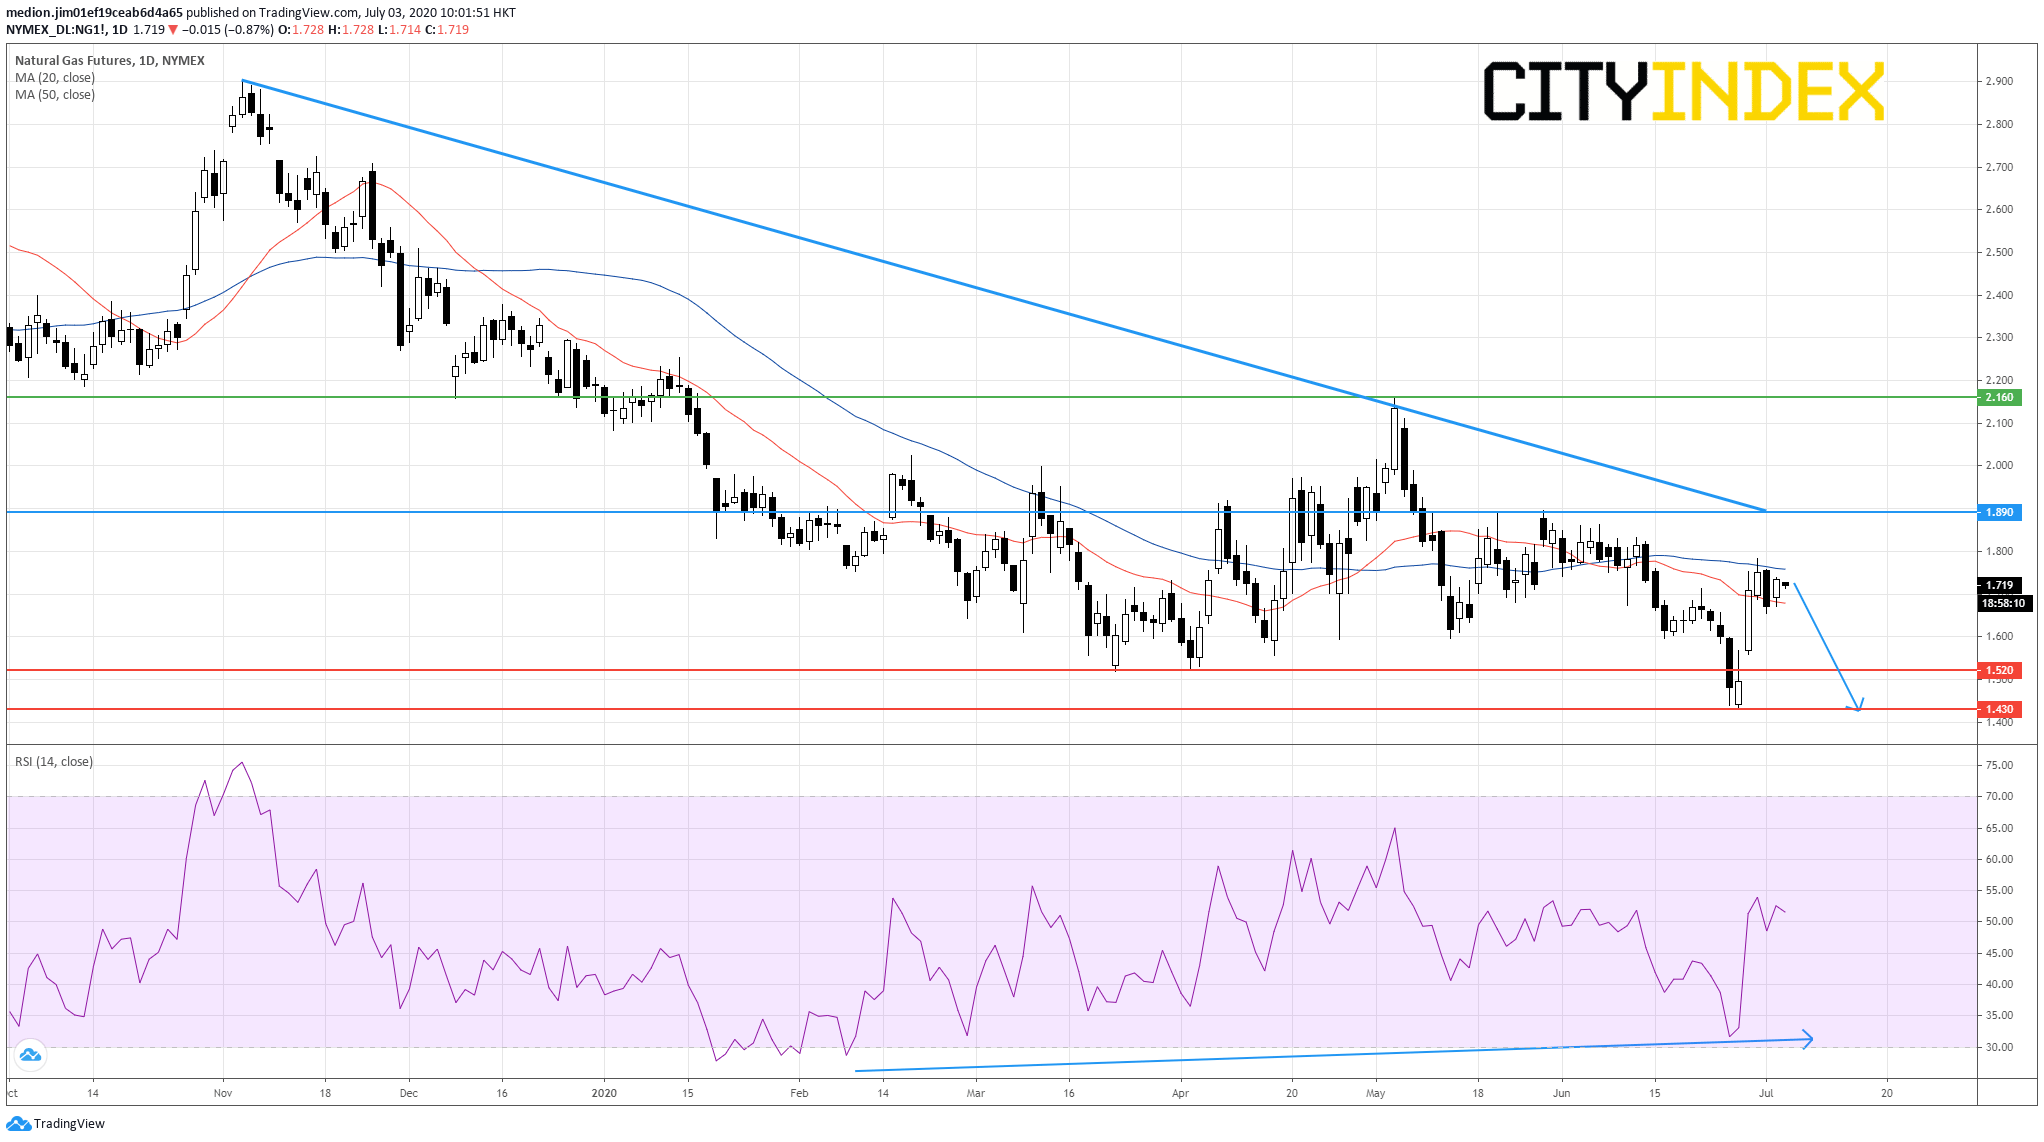
From a technical point of view, natural gas futures broke below the March low at $1.52 before posting a strong rebound from $1.43 on a daily chart.
Currently, the prices remain capped by a declining trend line drawn from December 2019 and falling 50-day moving average. Both technical configuration would favour the bearish outlook.
In an alternative scenario, a break above $1.89 would signal a bullish breakout of the declining trend and would call for a rebound to $2.16 (the high of May).
Source: GAIN Capital, TradingView
Source: Trading Economic
In the above chart, the natural gas storage storage is increasing after April. In fact, there would be a seasonal cycle to build the stockpile during April to November. Therefore, it would expect the continuation of increasing the natural gas storage.
The International Energy Agency estimated that the global consumption of natural gas would drop by 4% this year, or twice amount lost after the 2008 global financial crisis.
From a technical point of view, natural gas futures broke below the March low at $1.52 before posting a strong rebound from $1.43 on a daily chart.
Currently, the prices remain capped by a declining trend line drawn from December 2019 and falling 50-day moving average. Both technical configuration would favour the bearish outlook.
However, investors should alert that the bullish divergence signal from RSI is forming. It would indicate the loss of downward momentum for the prices.
Therefore, as long as the previous high at $1.89 is not surpassed, natural gas could consider a limited downside to $1.52 (the low of March) and $1.43 (the low of June).
In an alternative scenario, a break above $1.89 would signal a bullish breakout of the declining trend and would call for a rebound to $2.16 (the high of May).
Source: GAIN Capital, TradingView
The U.S. Energy Information Administration (EIA) said the storage of natural gas increased by 65 billion cubic feet to 3,077 billion cubic feet for the week ended June 26. The total working gas storage increased by 30.1% from last year.
Source: Trading Economic
In the above chart, the natural gas storage storage is increasing after April. In fact, there would be a seasonal cycle to build the stockpile during April to November. Therefore, it would expect the continuation of increasing the natural gas storage.
The International Energy Agency estimated that the global consumption of natural gas would drop by 4% this year, or twice amount lost after the 2008 global financial crisis.
From a technical point of view, natural gas futures broke below the March low at $1.52 before posting a strong rebound from $1.43 on a daily chart.
Currently, the prices remain capped by a declining trend line drawn from December 2019 and falling 50-day moving average. Both technical configuration would favour the bearish outlook.
In an alternative scenario, a break above $1.89 would signal a bullish breakout of the declining trend and would call for a rebound to $2.16 (the high of May).

Source: GAIN Capital, TradingView
Source: Trading Economic
In the above chart, the natural gas storage storage is increasing after April. In fact, there would be a seasonal cycle to build the stockpile during April to November. Therefore, it would expect the continuation of increasing the natural gas storage.
The International Energy Agency estimated that the global consumption of natural gas would drop by 4% this year, or twice amount lost after the 2008 global financial crisis.
From a technical point of view, natural gas futures broke below the March low at $1.52 before posting a strong rebound from $1.43 on a daily chart.
Currently, the prices remain capped by a declining trend line drawn from December 2019 and falling 50-day moving average. Both technical configuration would favour the bearish outlook.
However, investors should alert that the bullish divergence signal from RSI is forming. It would indicate the loss of downward momentum for the prices.
Therefore, as long as the previous high at $1.89 is not surpassed, natural gas could consider a limited downside to $1.52 (the low of March) and $1.43 (the low of June).
In an alternative scenario, a break above $1.89 would signal a bullish breakout of the declining trend and would call for a rebound to $2.16 (the high of May).
Source: GAIN Capital, TradingView
Related tags:
Latest market news




The complete CFD trading experience
Award-winning platforms, competitive spreads, low commissions and dedicated support.
We live and breathe the markets and are dedicated to helping traders realise their ambitions as we continue to set the industry bar.
Economic calendar
Web Trader platform
Our sophisticated web-based platform is packed with features.
Related articles

Gold, silver shrug off a brutal macro stress test
A hawkish Fed, surging short-dated Treasury yields and a firmer dollar failed to deliver the kind of damage usually seen in precious metals.


Gold Technical Outlook: XAU/USD Bulls Regroup at a Critical Pivot Ahead of Fed 9 16 2026
Gold is attempting to stabilize near a pivotal technical zone, with the Fed decision poised to provide the catalyst for the next major move.


Gold Analysis: XAU/USD Struggles to Regain Momentum After CPI Data
As the trading week comes to an end, one of the most relevant developments has been the neutral behavior displayed by gold in the short term. Over the last four trading sessions, price action has registered only a modest move of around -0.36%, a dynamic that highlights the recent lack of momentum around the metal.

StoneX Europe Ltd may make third party material available on this website which may contain information included but not limited to the conditions of financial markets. The material is for information purposes only and does not contain, and should not be construed as containing, investment advice and/or investment recommendation and/or an investment research and/or an offer of or solicitation for any transactions in financial instruments; any decision to enter into a specific transaction shall be made by the client following an assessment by him/her of their situation.
StoneX Europe Ltd makes no representation or warranty and assumes no liability as to the accuracy or completeness of the information provided, nor any loss arising from any investment based on a recommendation, forecast or other information supplied. You should always seek independent advice as to your suitability to speculate in any related markets and your ability to assume the associated risks, if you are at all unsure. We are not under any obligation to update any such material. Any opinion made may be personal to the author and may not reflect the opinion of StoneX Europe Ltd.