



NFP Recap: Jobs report much stronger than expected
The Non Farms Payrolls print for January, combined with the December revision, blows estimates out of the water!
Share this:

Markets were warned earlier in the month by the White House that the Non-Farm Payroll print could be weak as 9,000,000 people called in sick during the survey period, primarily due to the Omicron virus. In addition, the ADP Employment Change released on Wednesday showed a decrease of 301,000 private jobs in the economy for January, vs an expectation of +207,000. Therefore, a worse than expected headline print for Non-Farm Payrolls was expected. But the NFP print defied the odds!
The January Non-Farm Payroll print was +467,000 vs an expectation of +150,000. In addition, the December print was revised higher from +199,000 to +510,000! Therefore, the net number of jobs added to the economy was +778,000! In addition, Average Hourly Earnings rose by 0.7% MoM vs 0.5% MoM expected. The Unemployment Rate did uptick to 4.0% vs 3.9% in December, however that was mainly due to a rise in the Labor Participation Rate, which was 62.2% vs 61.9% in December.
The Federal Reserve will be pleased to see this data. It already considered the economy to be at maximum employment, so the jobs report will reinforce that. In addition, the Fed will be happy to see the increase in the participation rate, despite the small uptick in the Unemployment Rate. The one issue the Fed may have is with Average Hourly Earnings. Although the Fed wants to see earnings and wages increasing with inflation, Fed Chairman Powell noted that the Fed was concerned about wages rising too fast.
The US Dollar had gone bid immediately after the release on concerns that Fed may not only hike rates in March, but hike by 50bps instead of 25 bps. Bonds and stocks initially sold off.
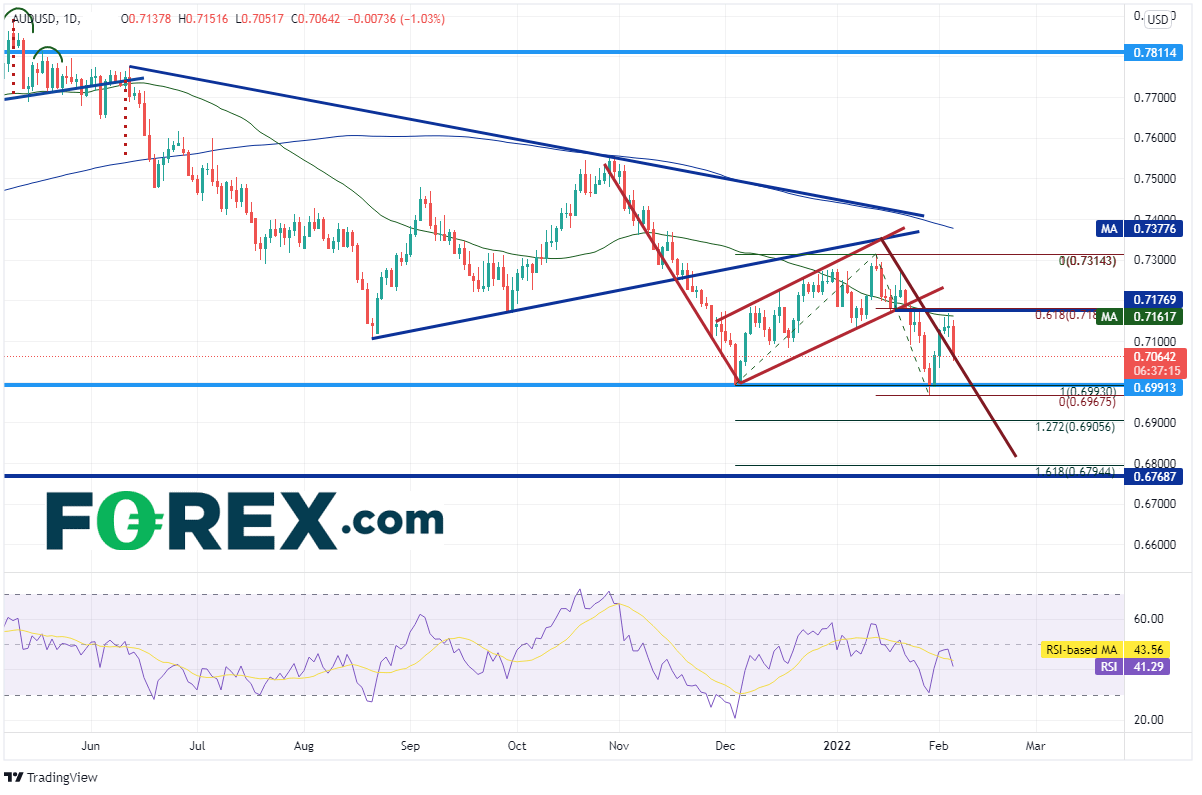
AUD/USD had already been moving lower on a daily timeframe since breaking below the symmetrical triangle on November 19th, 2021. The pair tested prior lows near 0.6990 (November 2nd, 2020 lows) and bounced to test the underside of the bottom trendline of the symmetrical triangle near 0.7314. In doing so, AUD/USD formed a flag pattern. Price formed an evening star candlestick formation (bearish) at the peak of the flag and began moving lower. On January 24th, the pair broke below the flag pattern and began heading towards its target, near 0.6800.
Source: Tradingview, Stone X
On a 240-minute chart, AUD/USD traded down the 0.6990 support level and bounced again, this time to the 61.8% Fibonacci retracement level from the highs of January 13th to the lows of January 28th, near 0.7175. This is also horizontal resistance (0.7182) and the near the 50 Day Moving Average (see daily). After today’s data release, the pair resumed its move lower towards the flag target.

Source: Tradingview, Stone X
Above the 0.7175/0.7182 resistance level, the next resistance is at the bottom, upward sloping trendline of the flag pattern near 0.7240. The January 13th highs of 0.7314 provides the 3rd level of resistance. First support is at the January 28th lows near 0.6967, then the 127.2% Fibonacci extension from the lows of December 3rd to the highs of January 14th at 0.6905. The 3rd level of support is at the 161.8% Fibonacci extension from that same timeframe (and the flag target) near 0.6800.
The NFP report today was much stronger than expected, almost across the board. This should give the Fed confidence in raising rates at the March meeting (provided February’s jobs report isn’t horrible). However, the strong Average Hourly Earnings print must lead traders to question: Will they raise 25bps or 50bps?
Markets were warned earlier in the month by the White House that the Non-Farm Payroll print could be weak as 9,000,000 people called in sick during the survey period, primarily due to the Omicron virus. In addition, the ADP Employment Change released on Wednesday showed a decrease of 301,000 private jobs in the economy for January, vs an expectation of +207,000. Therefore, a worse than expected headline print for Non-Farm Payrolls was expected. But the NFP print defied the odds!
The January Non-Farm Payroll print was +467,000 vs an expectation of +150,000. In addition, the December print was revised higher from +199,000 to +510,000! Therefore, the net number of jobs added to the economy was +778,000! In addition, Average Hourly Earnings rose by 0.7% MoM vs 0.5% MoM expected. The Unemployment Rate did uptick to 4.0% vs 3.9% in December, however that was mainly due to a rise in the Labor Participation Rate, which was 62.2% vs 61.9% in December.
The Federal Reserve will be pleased to see this data. It already considered the economy to be at maximum employment, so the jobs report will reinforce that. In addition, the Fed will be happy to see the increase in the participation rate, despite the small uptick in the Unemployment Rate. The one issue the Fed may have is with Average Hourly Earnings. Although the Fed wants to see earnings and wages increasing with inflation, Fed Chairman Powell noted that the Fed was concerned about wages rising too fast.
The US Dollar had gone bid immediately after the release on concerns that Fed may not only hike rates in March, but hike by 50bps instead of 25 bps. Bonds and stocks initially sold off.
AUD/USD had already been moving lower on a daily timeframe since breaking below the symmetrical triangle on November 19th, 2021. The pair tested prior lows near 0.6990 (November 2nd, 2020 lows) and bounced to test the underside of the bottom trendline of the symmetrical triangle near 0.7314. In doing so, AUD/USD formed a flag pattern. Price formed an evening star candlestick formation (bearish) at the peak of the flag and began moving lower. On January 24th, the pair broke below the flag pattern and began heading towards its target, near 0.6800.
Source: Tradingview, Stone X
On a 240-minute chart, AUD/USD traded down the 0.6990 support level and bounced again, this time to the 61.8% Fibonacci retracement level from the highs of January 13th to the lows of January 28th, near 0.7175. This is also horizontal resistance (0.7182) and the near the 50 Day Moving Average (see daily). After today’s data release, the pair resumed its move lower towards the flag target.

Source: Tradingview, Stone X
Above the 0.7175/0.7182 resistance level, the next resistance is at the bottom, upward sloping trendline of the flag pattern near 0.7240. The January 13th highs of 0.7314 provides the 3rd level of resistance. First support is at the January 28th lows near 0.6967, then the 127.2% Fibonacci extension from the lows of December 3rd to the highs of January 14th at 0.6905. The 3rd level of support is at the 161.8% Fibonacci extension from that same timeframe (and the flag target) near 0.6800.
The NFP report today was much stronger than expected, almost across the board. This should give the Fed confidence in raising rates at the March meeting (provided February’s jobs report isn’t horrible). However, the strong Average Hourly Earnings print must lead traders to question: Will they raise 25bps or 50bps?
Related tags:
Latest market news




The complete CFD trading experience
Award-winning platforms, competitive spreads, low commissions and dedicated support.
We live and breathe the markets and are dedicated to helping traders realise their ambitions as we continue to set the industry bar.
Economic calendar
Web Trader platform
Our sophisticated web-based platform is packed with features.
Related articles
Japanese Yen Forecast: USD/JPY 4% Rally Challenges Post-Intervention Downtrend 9 24 2026
USD/JPY momentum has shifted sharply higher, putting a major resistance confluence in focus as U.S. and Japanese event risk builds.

Oil Quietly Hands the Fed a Reason to Stay Hawkish
Oil prices and the U.S. dollar are both on the front foot as elevated energy costs feed Fed warnings that inflation may prove sticky.

S&P 500 forecast: Stocks extend drop as correction risks grow
US and global equity markets have extended Wednesday’s sell-off, with Wall Street opening lower after a weak handover from Asia and Europe. The deterioration in risk appetite has been spreading across global markets. The dollar was firmer, Treasury yields were holding onto yesterday’s gains, while gold, silver and bitcoin were all under pressure alongside equities and major currencies.
StoneX Europe Ltd may make third party material available on this website which may contain information included but not limited to the conditions of financial markets. The material is for information purposes only and does not contain, and should not be construed as containing, investment advice and/or investment recommendation and/or an investment research and/or an offer of or solicitation for any transactions in financial instruments; any decision to enter into a specific transaction shall be made by the client following an assessment by him/her of their situation.
StoneX Europe Ltd makes no representation or warranty and assumes no liability as to the accuracy or completeness of the information provided, nor any loss arising from any investment based on a recommendation, forecast or other information supplied. You should always seek independent advice as to your suitability to speculate in any related markets and your ability to assume the associated risks, if you are at all unsure. We are not under any obligation to update any such material. Any opinion made may be personal to the author and may not reflect the opinion of StoneX Europe Ltd.