




RBA Discussed Keeping Cuts For Emergencies
Whilst the overall message in RBA’s minutes remained the same (expect further cuts) they did at least discuss keeping them for a rainy day
Share this:

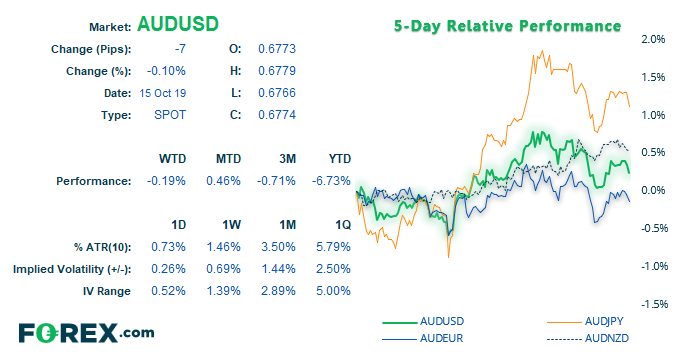
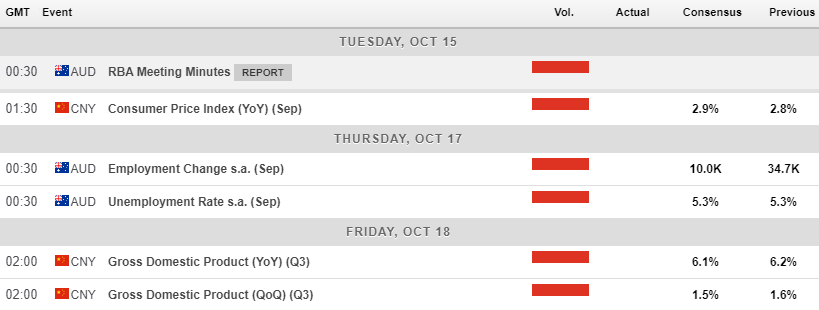
As my colleague Joe Perry mentioned, it could be a busy week for AUD given the slew of data from China alongside AU employment data on Thursday. RBA just released the minutes from their October meeting, although the underlying message remains consistent; expect rates to remain low, they could go lower, and employment and consumption are key metrics. That said, there are signs that they’re thinking about how low rates really should go, having discussed keeping rate cuts in reserve for emergencies, and the risks that low rates would inflate (already overinflated?!) home and asset prices.
The reaction was minimal at best although, on the domestic front, Thursday’s employment report could provide the catalyst for volatility. Whilst employment growth has remains strong, RBA expect it to slow. Given full-time employment is now softening on a year over year basis and unemployment is rising against RBA’s wishes, then a worse than expected employment report on Thursday could bring forward expectations of another RBA cut. And this is before we add Chinese data to the mix.
Still, with so much data on tap, it can also muddy the waters where price action is concerned. Whilst weak data from China and AU is generally a bearish case for the Aussie, that’s quite a few data points we’d need to see miss the mark. Furthermore, if data from China gets too bad, it can inadvertently trigger a risk-on rally as markets assume yet more fiscal policy is on the cards from Beijing (after the initial knee-jerk, bearish reaction). Of course, we’ll have to wait for the data to come in to confirm, but it could also surprise to the upside and support AUD. So for now, here’s a couple of potential setups which may be of interest for bulls, if the data allows.
EUR/AUD: This cross may not provide the nicest of trends on the daily chart, yet when volatility erupts it can provide large swings. In the last week for July, for example, it rallied over 5.5% in 11 sessions in practically a straight line, which could have also provided shallow pullbacks and continuation patterns on lower timeframes. Yet recently prices have been coiling within a potential bearish wedge. As this follows on from a move lower, we’re looking for a break lower as part of a continuation patter.
- The rebound from 1.5900 is coiling and shows potential for a bearish wedge pattern
- Resistance has been found below a 61.8% Fibonacci level, with a double top pattern sitting around 1.6370
- Bears could look for a break below 1.6200 to confirm a breakout from the wedge and target the low around 1.5900
- However, wedge needn’t be perfect and remain within their converging trendlines. It’s also possible we could see another high before the peak is in, so allow for some noise around these levels. Ideally, we want to see clearly that bearish momentum has returned.
AUD/NZD: Prices are trading within a potential corrective channel / flag, although there’s also the risk we could see it recycle lower within the pattern before it’s bullish breakout. In some way this would be preferred, as it could improve potential reward to risk ratio for bulls.
- The daily structure remains bullish above 1.0665 and the 50-day eMA has acted as support. Bulls could look for a break of the channel to signal the next leg higher.
- Initial bullish target is the 1.0840 high, followed by 1.0900.
- Still, if the bearish channel is to deepen, we could use the zone around 1.0620/23 as the next line of defence for bulls; therefor, a break below 1.0620/23 invalidates the bullish bias.
Related analysis:
China and Australian Data May Push AUD/USD Lower
RBA Cut Rates To A Fresh Record Low
As my colleague Joe Perry mentioned, it could be a busy week for AUD given the slew of data from China alongside AU employment data on Thursday. RBA just released the minutes from their October meeting, although the underlying message remains consistent; expect rates to remain low, they could go lower, and employment and consumption are key metrics. That said, there are signs that they’re thinking about how low rates really should go, having discussed keeping rate cuts in reserve for emergencies, and the risks that low rates would inflate (already overinflated?!) home and asset prices.
The reaction was minimal at best although, on the domestic front, Thursday’s employment report could provide the catalyst for volatility. Whilst employment growth has remains strong, RBA expect it to slow. Given full-time employment is now softening on a year over year basis and unemployment is rising against RBA’s wishes, then a worse than expected employment report on Thursday could bring forward expectations of another RBA cut. And this is before we add Chinese data to the mix.
Still, with so much data on tap, it can also muddy the waters where price action is concerned. Whilst weak data from China and AU is generally a bearish case for the Aussie, that’s quite a few data points we’d need to see miss the mark. Furthermore, if data from China gets too bad, it can inadvertently trigger a risk-on rally as markets assume yet more fiscal policy is on the cards from Beijing (after the initial knee-jerk, bearish reaction). Of course, we’ll have to wait for the data to come in to confirm, but it could also surprise to the upside and support AUD. So for now, here’s a couple of potential setups which may be of interest for bulls, if the data allows.
EUR/AUD: This cross may not provide the nicest of trends on the daily chart, yet when volatility erupts it can provide large swings. In the last week for July, for example, it rallied over 5.5% in 11 sessions in practically a straight line, which could have also provided shallow pullbacks and continuation patterns on lower timeframes. Yet recently prices have been coiling within a potential bearish wedge. As this follows on from a move lower, we’re looking for a break lower as part of a continuation patter.
- The rebound from 1.5900 is coiling and shows potential for a bearish wedge pattern
- Resistance has been found below a 61.8% Fibonacci level, with a double top pattern sitting around 1.6370
- Bears could look for a break below 1.6200 to confirm a breakout from the wedge and target the low around 1.5900
- However, wedge needn’t be perfect and remain within their converging trendlines. It’s also possible we could see another high before the peak is in, so allow for some noise around these levels. Ideally, we want to see clearly that bearish momentum has returned.
AUD/NZD: Prices are trading within a potential corrective channel / flag, although there’s also the risk we could see it recycle lower within the pattern before it’s bullish breakout. In some way this would be preferred, as it could improve potential reward to risk ratio for bulls.
- The daily structure remains bullish above 1.0665 and the 50-day eMA has acted as support. Bulls could look for a break of the channel to signal the next leg higher.
- Initial bullish target is the 1.0840 high, followed by 1.0900.
- Still, if the bearish channel is to deepen, we could use the zone around 1.0620/23 as the next line of defence for bulls; therefor, a break below 1.0620/23 invalidates the bullish bias.
Related analysis:
China and Australian Data May Push AUD/USD Lower
RBA Cut Rates To A Fresh Record Low
Related tags:
Latest market news




The complete CFD trading experience
Award-winning platforms, competitive spreads, low commissions and dedicated support.
We live and breathe the markets and are dedicated to helping traders realise their ambitions as we continue to set the industry bar.
Economic calendar
Web Trader platform
Our sophisticated web-based platform is packed with features.
Related articles
USD/JPY outlook: Hawkish Fed recalibration pressures the yen
Stronger US growth momentum and rising Treasury yields are keeping USD/JPY pointed higher, even as Japanese policymakers try to limit the pressure building across domestic markets.
USD/MXN Forecast: Peso Loses Momentum Ahead of Banxico Decision
Over recent trading sessions, the Mexican peso has started to show signs of losing strength against the U.S. dollar. This can be seen in the performance of USD/MXN, which has gained more than 1.7% over the last three sessions, highlighting the dollar's renewed strength against the peso.

Euro Short-term Outlook: EUR/USD Selloff Nears Critical Yearly Support 9 23 2026
Euro has fallen seven of the past nine sessions, with stretched momentum raising the stakes as EUR/USD closes in on a major inflection zone.

StoneX Europe Ltd may make third party material available on this website which may contain information included but not limited to the conditions of financial markets. The material is for information purposes only and does not contain, and should not be construed as containing, investment advice and/or investment recommendation and/or an investment research and/or an offer of or solicitation for any transactions in financial instruments; any decision to enter into a specific transaction shall be made by the client following an assessment by him/her of their situation.
StoneX Europe Ltd makes no representation or warranty and assumes no liability as to the accuracy or completeness of the information provided, nor any loss arising from any investment based on a recommendation, forecast or other information supplied. You should always seek independent advice as to your suitability to speculate in any related markets and your ability to assume the associated risks, if you are at all unsure. We are not under any obligation to update any such material. Any opinion made may be personal to the author and may not reflect the opinion of StoneX Europe Ltd.