




S&P 500 forecast: Forward testing the S&P 500 around Thanksgiving
I have always had an inkling that US equity markets tend to perform well heading into Thanksgiving. So today, I put that theory to the test.
Share this:

Takeaways
- A positive expectancy for the S&P 500 is apparent in the days leading into Thanksgiving
- There is also a tendency for the S&P 500 to weaken on the Monday following Thanksgiving, before rising on the Tuesday
- Whilst this data does not provide a solid roadmap for likely price direction, it does provide statistical comfort of a directional bias ahead and following Thanksgiving
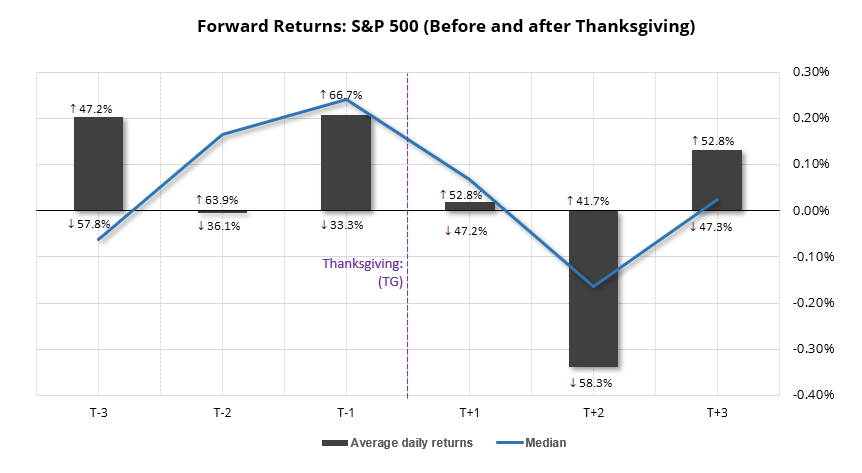
Using daily data since 1987, I have looked at how the S&P 500 performs in the three days prior and beyond US Thanksgiving. As markets are closed on Thanksgiving, it means we’re looking at the three days up to the close on Thanksgiving eve, and the three following Thanksgiving when the markets are open.
S&P 500 average daily returns around Thanksgiving
T-1 is the day prior to Thanksgiving (or ‘Thanksgiving eve’, if there I such a thing), whereas T+3 is the third business day following Thanksgiving. Each bar represents one day, of the average return for each period.
S&P 500 analysis: Heading into Thanksgiving
Whilst there is a positive average return ahead of Thanksgiving (TG) on T-3 and T-1, we actually see a slight negative average return on T-2. As TG in on Thursday this year, it could suggest that Monday and Wednesday provide better odds of up days then Tuesday.
However, T-3 only has a 47.2% average positive return over the sample, whilst T-1 has the highest average return alongside a 66.7% win rate. Perhaps Wednesday may stand the best chance of an up day this year. And the fact that T-2 has a negative average return with a 64% win rate, it suggests the down days have been considerably larger than the up days over the sample. And that is why the median return is positive for T-2 and the highest for T-1.
S&P 500 analysis: After Thanksgiving
The day following TG (T+1) seems like a coin flip with a minor average positive turn and only a slight increase of up days relative to down. And as many traders take an extra day of vacation on the Friday to achieve a nice 4-day weekend, perhaps this makes sense. It is therefore interesting to note that T+2 (the following Monday) has a clear bearish bias with average return of -0.34% with a down-day rate of nearly 60%. It seems whatever optimism traders expressed heading into the long weekend is truly over when they return to their desks on the Monday.
A smoother way of looking at the data is to use a rate of change between the respective day and TG. And looking at the data this way better shows that my inking was on the right track; traders prefer to buy the S&P 500 heading into S&P 500. It also shows a desire to sell the S&P 500 thereafter. So how does this stack up against current price action?
S&P 500 daily chart:
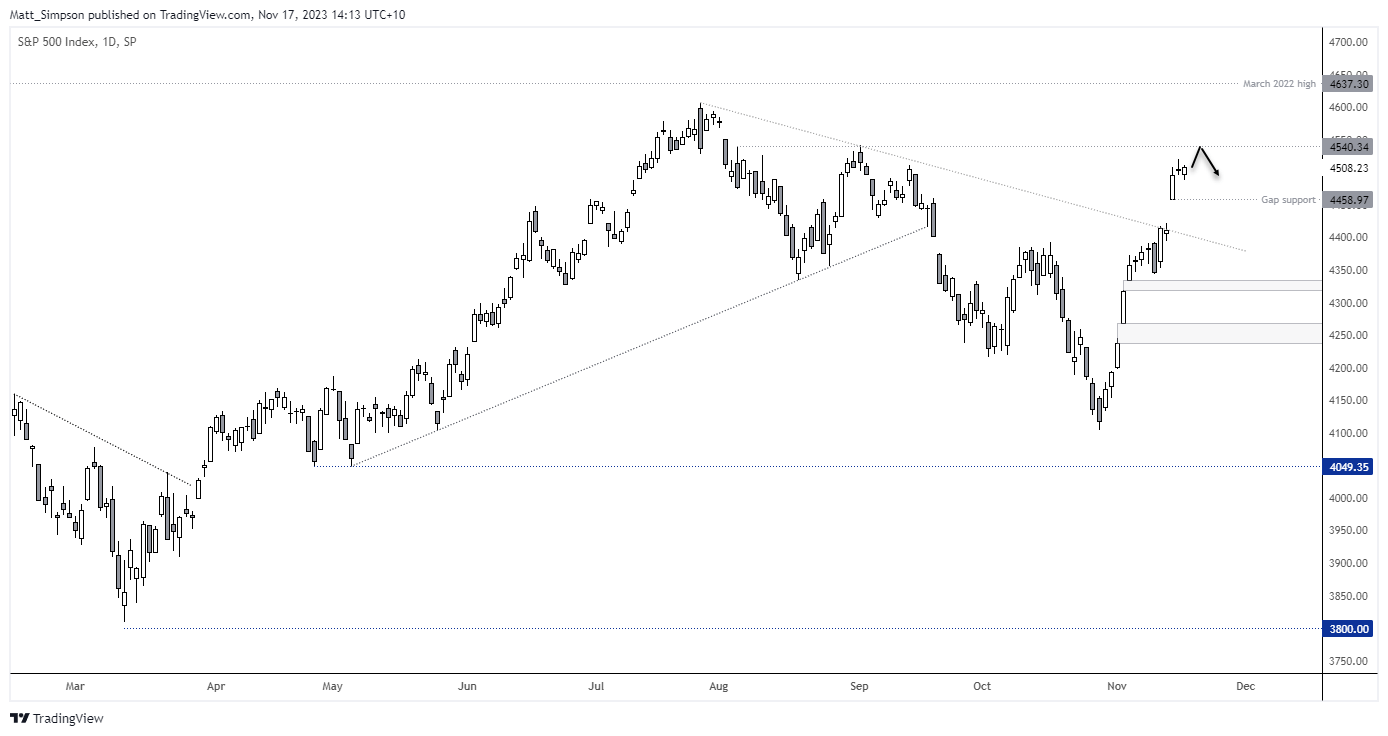
The main issue I have with simply assuming a rally ahead of Thanksgiving next week is that we have already seen an extended run, and it is near resistance around 4540. The daily chart shows volatility has subsided over the past two days after its 10% rally into Wednesday’s high. But perhaps we’ll be treated to a pullback during the final session of this week later today. In which case, bulls could seek intraday bullish setup on Monday, Tuesday or Wednesday next week if price action respects intraday support levels.
Of course, as these stats are backwards looking and simply show average returns which smooth over the data set and ignore individual stories behind a move on a given day, this data should not be used as a roadmap. But it does at least provide some statistical comfort that the odds favour a rally into Thanksgiving and a slight selloff thereafter, assuming no large macro theme arrives to dominate sentiment.
-- Written by Matt Simpson
Follow Matt on Twitter @cLeverEdge
How to trade with City Index
You can trade with City Index by following these four easy steps:
- Open an account, or log in if you’re already a customer
• Open an account in the UK
• Open an account in Australia
• Open an account in Singapore
- Search for the market you want to trade in our award-winning platform
- Choose your position and size, and your stop and limit levels
- Place the trade
Related tags:
Latest market news




The complete CFD trading experience
Award-winning platforms, competitive spreads, low commissions and dedicated support.
We live and breathe the markets and are dedicated to helping traders realise their ambitions as we continue to set the industry bar.
Economic calendar
Web Trader platform
Our sophisticated web-based platform is packed with features.
Related articles

Oil Quietly Hands the Fed a Reason to Stay Hawkish
Oil prices and the U.S. dollar are both on the front foot as elevated energy costs feed Fed warnings that inflation may prove sticky.


S&P 500 forecast: Stocks extend drop as correction risks grow
US and global equity markets have extended Wednesday’s sell-off, with Wall Street opening lower after a weak handover from Asia and Europe. The deterioration in risk appetite has been spreading across global markets. The dollar was firmer, Treasury yields were holding onto yesterday’s gains, while gold, silver and bitcoin were all under pressure alongside equities and major currencies.

Gold forecast: XAU/USD could take a larger dive after the big rise in yields
Gold prices have been falling in the last few days after last week’s post-FOMC pop faded amid rising interest rate expectations, higher oil prices and a strengthening US dollar. As before, I wasn’t convinced gold would thrive in the current macro backdrop.
StoneX Europe Ltd may make third party material available on this website which may contain information included but not limited to the conditions of financial markets. The material is for information purposes only and does not contain, and should not be construed as containing, investment advice and/or investment recommendation and/or an investment research and/or an offer of or solicitation for any transactions in financial instruments; any decision to enter into a specific transaction shall be made by the client following an assessment by him/her of their situation.
StoneX Europe Ltd makes no representation or warranty and assumes no liability as to the accuracy or completeness of the information provided, nor any loss arising from any investment based on a recommendation, forecast or other information supplied. You should always seek independent advice as to your suitability to speculate in any related markets and your ability to assume the associated risks, if you are at all unsure. We are not under any obligation to update any such material. Any opinion made may be personal to the author and may not reflect the opinion of StoneX Europe Ltd.