





Tesla TSLA pump from Elon
Elon Musk sent an email to employees in which he declared, “This will be Tesla’s most intense delivery week ever!”
Share this:

Although many of the pollsters were wrong, or inaccurate, regarding some of the Presidential state outcomes, it appears that Biden may end of winning after all. But Trump has already laid the groundwork for contesting the results. The big question now is: If Biden wins, will the markets care about Trump’s court drama or will it just be a side show? We don’t know for sure, but we do know price action!
DXY
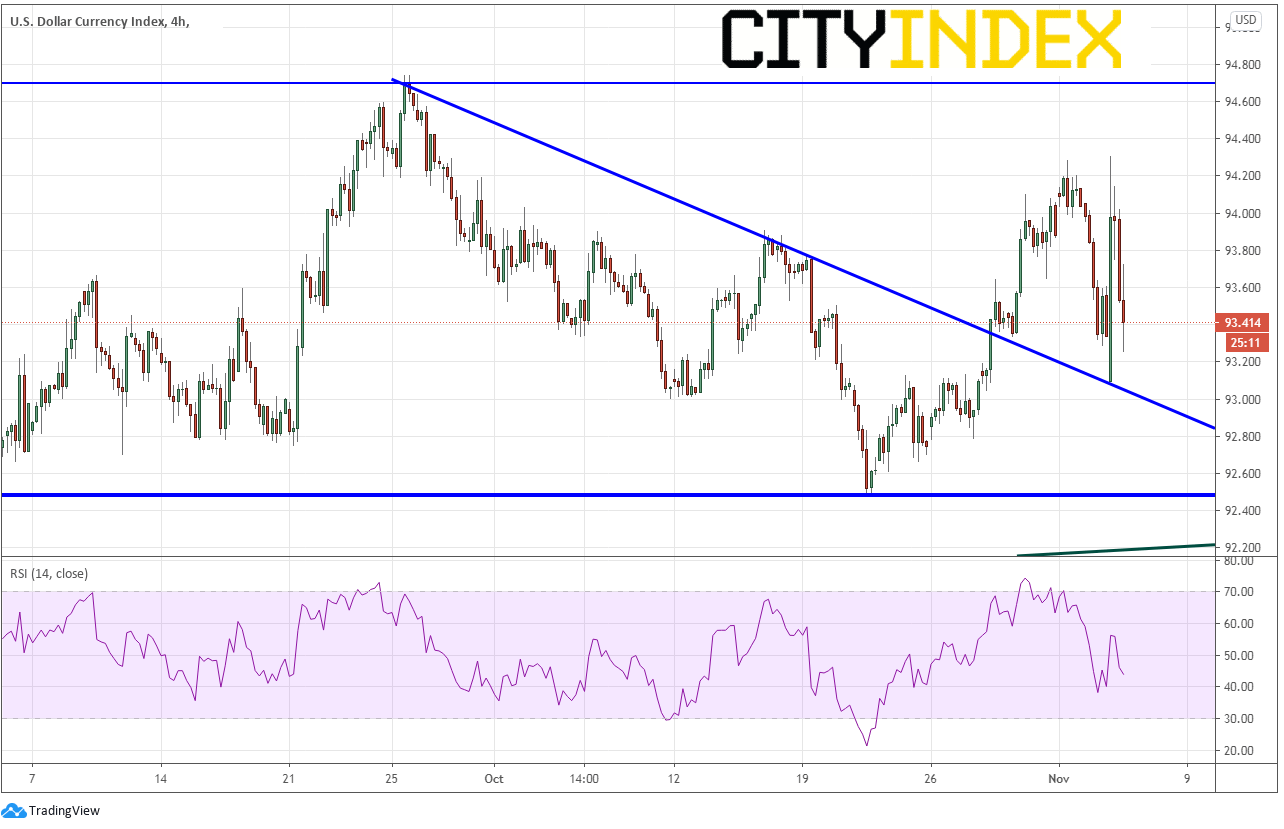
The US Dollar Index is moving lower. A Biden victory would mean more stimulus, more supply of US dollars in the system, and therefore, a lower price. After a break higher out of the descending triangle, price gapped open lower last night as the results began coming in and tested the downward sloping trendline of the triangle. However, price bounced as it appeared Trump may win. Price has since moved lower, but is still respecting the trendline. First support is yesterday’s lows and the intersecting downward trendline near 93.00. Below that is horizontal support near 92.50. Resistance is at overnight highs near 94.30.
Source: Tradingview, City Index
AUD/USD
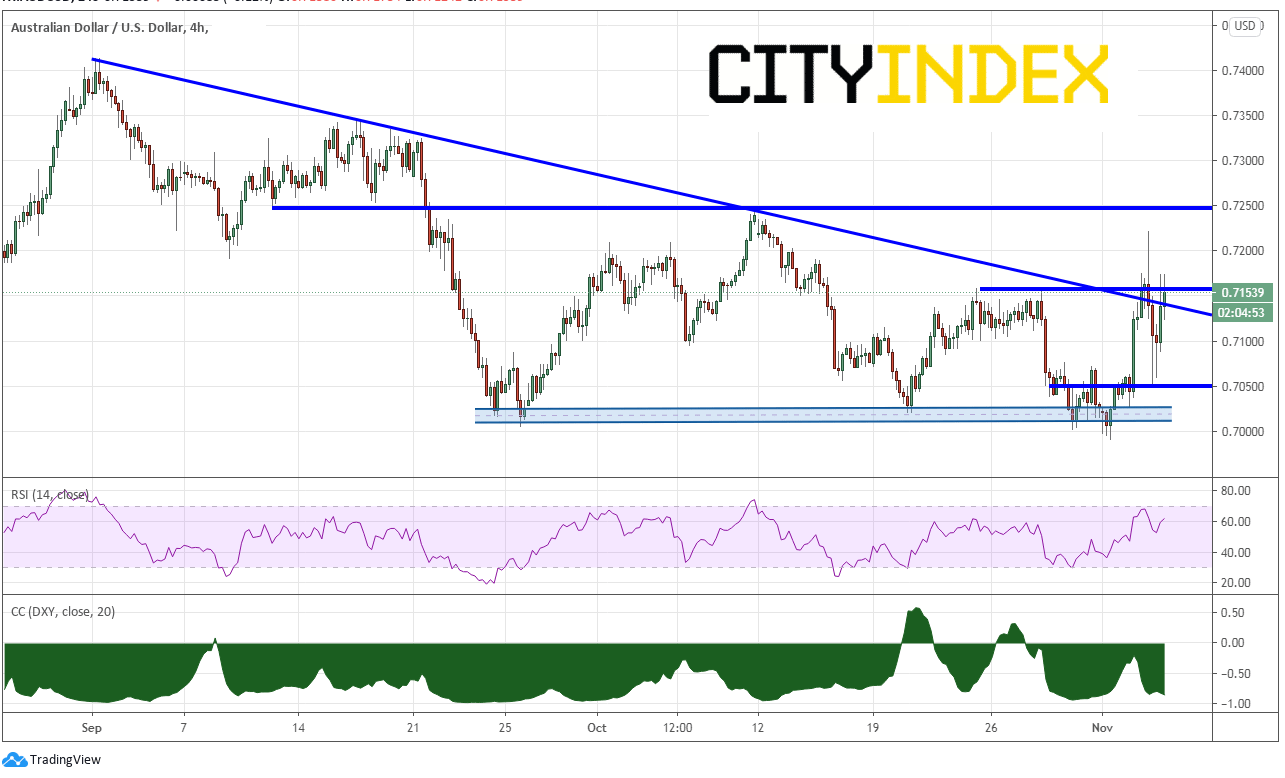
AUD/USD is currently trading at a -.85 correlation to the US Dollar Index (DXY). A correlation coefficient of -1.00 means that the 2 instruments are trading on a 1 for 1 opposite basis. So, a tick higher in DXY would mean a tick lower in AUD/USD. Therefore, Aussie traders may want to watch the DXY to give them for confidence in their decision on entering and exiting positions. Resistance above is at overnight highs near .7220 and then horizontal resistance near .7250. Support is at overnight lows near .7050.
Source: Tradingview, City Index
EUR/GBP
If one is searching for a trade that is away from all the drama of the US, that trader can turn attention to back to Brexit! EUR/GBP is currently up against trendline resistance, horizontal resistance and the previous 61.8% Fibonacci retracement form the lows of September 3rd to the highs of September 11th (previous support acts as resistance), near .9025. There is some short-term support below near .8990 and the overnight lows just below .8950. If price drops below, it can quickly accelerate to the September lows near .8860. Resistance is at .9030, then the downward sloping trendline from triangle on the 240-minute chart near .9075.
Source: Tradingview, City Index
If one is looking for volatility to trade, the US Dollar has provided plenty of it over the last 18 hours. However, there with an update due today on Brexit negotiations, so there is potential for volatility there as well!
Although many of the pollsters were wrong, or inaccurate, regarding some of the Presidential state outcomes, it appears that Biden may end of winning after all. But Trump has already laid the groundwork for contesting the results. The big question now is: If Biden wins, will the markets care about Trump’s court drama or will it just be a side show? We don’t know for sure, but we do know price action!
DXY
The US Dollar Index is moving lower. A Biden victory would mean more stimulus, more supply of US dollars in the system, and therefore, a lower price. After a break higher out of the descending triangle, price gapped open lower last night as the results began coming in and tested the downward sloping trendline of the triangle. However, price bounced as it appeared Trump may win. Price has since moved lower, but is still respecting the trendline. First support is yesterday’s lows and the intersecting downward trendline near 93.00. Below that is horizontal support near 92.50. Resistance is at overnight highs near 94.30.
Source: Tradingview, FOREX.com
AUD/USD
AUD/USD is currently trading at a -.85 correlation to the US Dollar Index (DXY). A correlation coefficient of -1.00 means that the 2 instruments are trading on a 1 for 1 opposite basis. So, a tick higher in DXY would mean a tick lower in AUD/USD. Therefore, Aussie traders may want to watch the DXY to give them for confidence in their decision on entering and exiting positions. Resistance above is at overnight highs near .7220 and then horizontal resistance near .7250. Support is at overnight lows near .7050.
Source: Tradingview, FOREX.com
EUR/GBP
If one is searching for a trade that is away from all the drama of the US, that trader can turn attention to back to Brexit! EUR/GBP is currently up against trendline resistance, horizontal resistance and the previous 61.8% Fibonacci retracement form the lows of September 3rd to the highs of September 11th (previous support acts as resistance), near .9025. There is some short-term support below near .8990 and the overnight lows just below .8950. If price drops below, it can quickly accelerate to the September lows near .8860. Resistance is at .9030, then the downward sloping trendline from triangle on the 240-minute chart near .9075.
Source: Tradingview, FOREX.com
If one is looking for volatility to trade, the US Dollar has provided plenty of it over the last 18 hours. However, there with an update due today on Brexit negotiations, so there is potential for volatility there as well!
Related tags:



The complete CFD trading experience
Award-winning platforms, competitive spreads, low commissions and dedicated support.
We live and breathe the markets and are dedicated to helping traders realise their ambitions as we continue to set the industry bar.
Economic calendar
Web Trader platform
Our sophisticated web-based platform is packed with features.
Related articles

Gold Outlook: XAU/USD hit hard as US yields, dollar resume ascent
A stronger dollar, surging front-end yields and renewed geopolitical tension have combined to push gold back towards key technical support.


S&P 500, Nasdaq, Dow Forecast: Wall Street Split Widens Into Month-End 9 26 2026
Nasdaq strength contrasts with mounting Dow pressure as rising Treasury yields raise the stakes for stocks heading into the monthly close.


EUR/USD weekly outlook: Oil, inflation and NFP in focus
After coming under significant pressure in recent weeks, the EUR/USD came off its lows to finish the week on a positive note on Friday, albeit with only a mild rebound. That was not enough to prevent the exchange rate falling for the third consecutive week, as the US dollar and bond yields rallied across the board.

StoneX Europe Ltd may make third party material available on this website which may contain information included but not limited to the conditions of financial markets. The material is for information purposes only and does not contain, and should not be construed as containing, investment advice and/or investment recommendation and/or an investment research and/or an offer of or solicitation for any transactions in financial instruments; any decision to enter into a specific transaction shall be made by the client following an assessment by him/her of their situation.
StoneX Europe Ltd makes no representation or warranty and assumes no liability as to the accuracy or completeness of the information provided, nor any loss arising from any investment based on a recommendation, forecast or other information supplied. You should always seek independent advice as to your suitability to speculate in any related markets and your ability to assume the associated risks, if you are at all unsure. We are not under any obligation to update any such material. Any opinion made may be personal to the author and may not reflect the opinion of StoneX Europe Ltd.