



Tesla’s price has doubled in six weeks, where to from here?
It may have taken a few weeks, but markets are finally pricing in what we argued all along; a higher terminal rate and no cuts this year.
Share this:

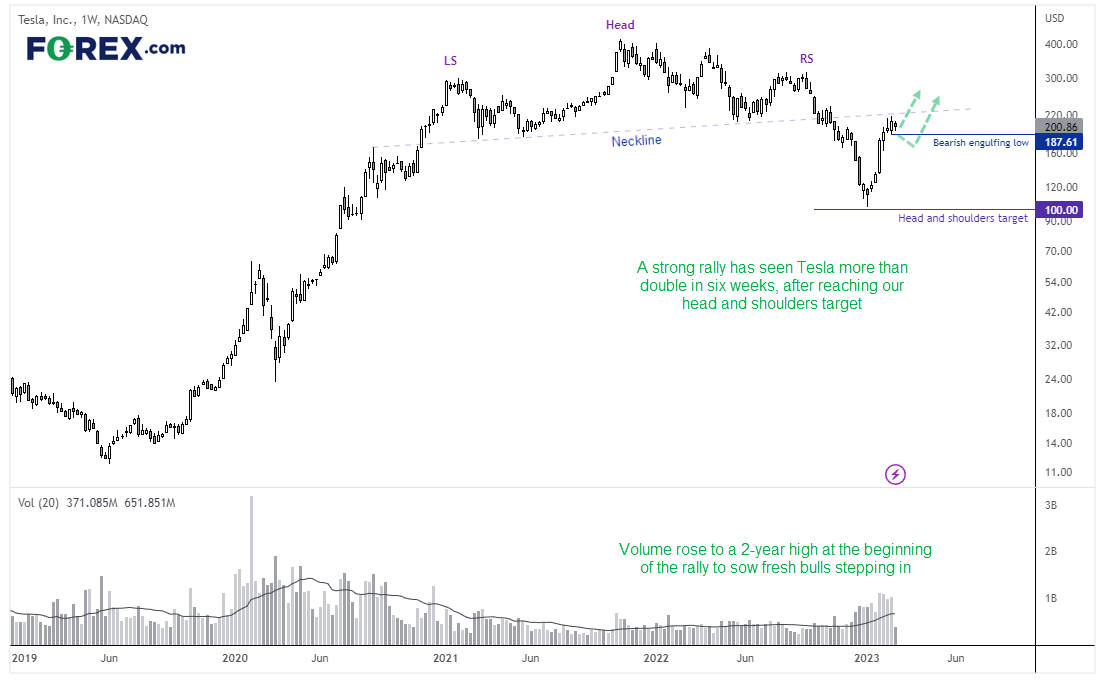
Back in October, we made an outlandish call for Tesla to more than halve and fall from $220 down to $100. Four months later, we are both delighted and somewhat saddened to see it came to fruition almost perfectly (although technically it only fell to $101.81, leaving out bear call out of pocket by $1.81 per share). It was nothing personal against the company or Elon, but we simply looked at the data and hypothesised an idea based it. So where is Tesla to go from here?
Back in October, we made an outlandish call for Tesla to more than halve and fall from $220 down to $100. Four months later, we are both delighted and somewhat saddened to see it came to fruition almost perfectly (although technically it only fell to $101.81, leaving out bear call out of pocket by $1.81 per share). It was nothing personal against the company or Elon, but we simply looked at the data and hypothesised an idea based it. So where is Tesla to go from here?
Incidentally, the stock is almost right back where it was in October and trades at $202.35, having more than doubled and rallied 113.8% in just six weeks.

Tesla (TSLA) weekly chart:
We can see on the weekly chart that the rally from $100 has been string and in a relatively straight line, and volumes rose to a two-year high to show fresh buyers entered the market and bears closed out. However, we’re approaching the broken neckline which could potentially prompt a pullback (or a consolidation), but the strong volume and price action suggests it could eventually break above it.
And whilst a bearish hammer formed two weeks ago, it was followed by a bullish engulfing week with higher volume to show demand at these highs. Therefore, a break below 187.61 assumes a pullback, but bulls may be interested in loading above this key level for a move to the neckline around $225.

Tesla (TSLA) daily chart:
The daily chart shows a small pullback withinside the range of a bullish engulfing candle at the highs. A small bullish hammer formed yesterday for a potential higher low above last week’s low, and the daily engulfing candle. After-hours trade also see it trade slightly higher. Also note that the 20 and 100-day EMA’s sit perfectly on last week’s low, making $187.61 an important support level for bulls to defend. RSI (14) remain positive above 50, so we’re looking for another burst higher on the daily chart.
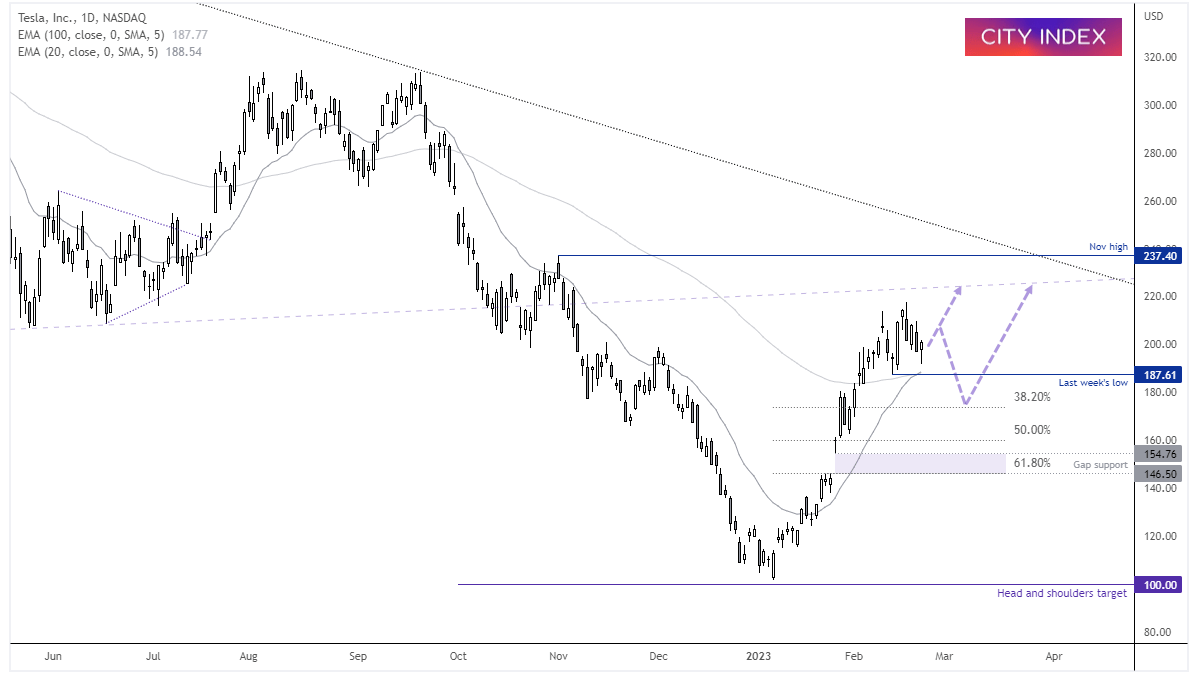

- The bias on the daily chart is bullish above $187.60
- We anticipated a move towards the $220 - $225 area (along the neckline, depending on how quickly it gets there), where we may then see a pullback from the broken neckline
- Keep in mind the November high around $237.4 which could also cap gains over the near-term
- A break below $187.60 assumes a deeper correction, where we’d then look for evidence of a swing low around a Fibonacci number or the ‘gap support’ zone’ (at which point reconsider longs, in line with weekly volume and momentum)
Latest market news




The complete CFD trading experience
Award-winning platforms, competitive spreads, low commissions and dedicated support.
We live and breathe the markets and are dedicated to helping traders realise their ambitions as we continue to set the industry bar.
Economic calendar
Web Trader platform
Our sophisticated web-based platform is packed with features.
Related articles
EUR/USD weekly outlook: Oil, inflation and NFP in focus
After coming under significant pressure in recent weeks, the EUR/USD came off its lows to finish the week on a positive note on Friday, albeit with only a mild rebound. That was not enough to prevent the exchange rate falling for the third consecutive week, as the US dollar and bond yields rallied across the board.

Gold Q4 2026 outlook: Resilience in the face of rallying dollar and yields
As we headed towards the latter stages of Q3 and into Q4, the Fed had just hiked rates in a hawkish FOMC meeting, while the likes of the ECB and BoJ had also tightened their respective policies. Oil prices remained elevated amid the prolonged US-Iran conflict. Meanwhile, bond yields were breaking out, and the dollar was higher across the board. Yet, remarkably, gold was still holding in the positive territory for the third quarter, even if it had weakened somewhat in September.

Oil Quietly Hands the Fed a Reason to Stay Hawkish
Oil prices and the U.S. dollar are both on the front foot as elevated energy costs feed Fed warnings that inflation may prove sticky.
StoneX Europe Ltd may make third party material available on this website which may contain information included but not limited to the conditions of financial markets. The material is for information purposes only and does not contain, and should not be construed as containing, investment advice and/or investment recommendation and/or an investment research and/or an offer of or solicitation for any transactions in financial instruments; any decision to enter into a specific transaction shall be made by the client following an assessment by him/her of their situation.
StoneX Europe Ltd makes no representation or warranty and assumes no liability as to the accuracy or completeness of the information provided, nor any loss arising from any investment based on a recommendation, forecast or other information supplied. You should always seek independent advice as to your suitability to speculate in any related markets and your ability to assume the associated risks, if you are at all unsure. We are not under any obligation to update any such material. Any opinion made may be personal to the author and may not reflect the opinion of StoneX Europe Ltd.