



Investors drive Tesla lower after mixed Q3 earnings report
Tesla shares were driven lower during after-hour trade following their Q3 earnings report, despite Elon Musk later touting a “record breaking Q4”.
Share this:

- Tesla shares fell around -7% after the close following their mixed Q3 earnings report.
- Reported revenue was $21.45bn compare with $22.09bn estimated, and adjusted EPS was $1.05 compared with $1.01 estimated.
- Raw material inflation was a factor which impacted their profitability, whilst operating income was negatively impacted by unfavourable currency moves.
- Battery supply chain issues are also likely to remain a limiting factor to the EV market over the medium-to-long term.


Tesla shares were lower after their mixed earnings report, which is likely a combination of traders booking profits from the small pre-earnings bounce in a classic case of ‘buy the rumour sell the fact’. But who knows, perhaps investors are tiring of Elon Musk’s showmanship remarks, which today included expectations of a “record breaking Q4” and the potential for “Tesla to be worth more than Apple and Apple and Saudi Aramco combined”. And it is hard not to be suspicious of the timing of such remarks looking at their YTD performance of -37% and him conceding that he’s overpaid for Twitter (but still “very excited”).
But let’s keep is simple and look at a potential multi-month reversal pattern on the monthly chart, and Tesla’s potential to break lower this week.
Tesla (TSLA) monthly chart:
Sometimes you really need to stand back to admire the view, and the monthly Tesla chart is no exception. Given it has risen over 22,000% since the stock was listed (and over 3,400% since the 2019 low alone) the Y-axis has been converted to logarithmic scale.

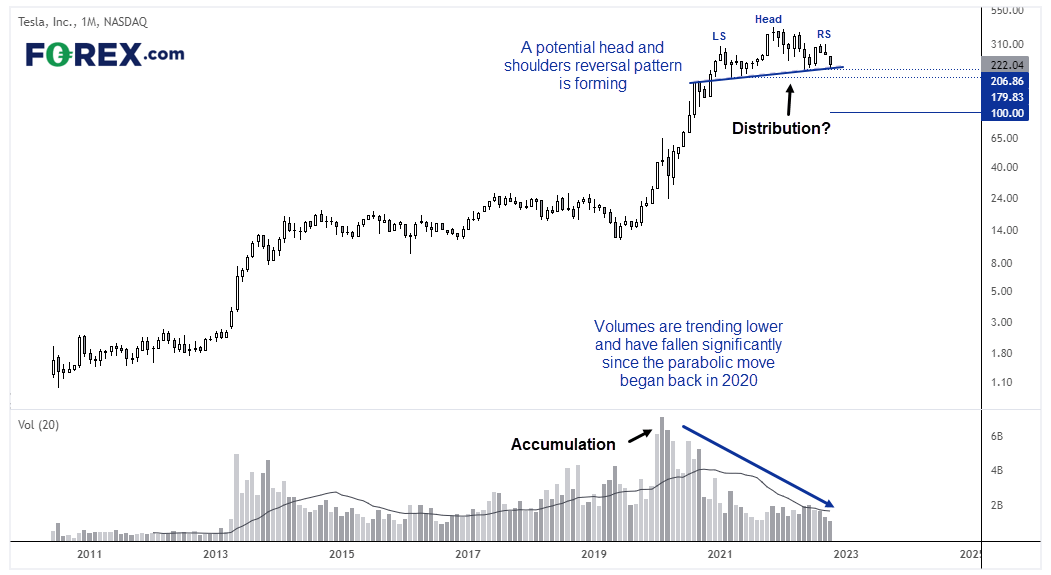
A couple of things really stand out. Volume peaked in February 2020 and has trended significantly over the past three years. Moreover, volume has been below average these past four months as buyers continue to lose steam. A head and shoulders reversal pattern is also in the making, with prices currently finding support around the neckline. If we used a standard chart the H&S pattern would measure a target around -$50 (yes, minus) but the logarithmic chart projects a move around $100 – which is roughly half of where is currently trades, and more realistic.
Whether we see the break lower or not may take time to come to fruition, given it is a weekly chart, but it is certainly a pattern to keep an eye on regardless.
Tesla (TSLA) daily chart:


A triple top formed around $315, and Tesla has trended lower on the daily chart since. We saw an initial false break of the neckline last week with a bearish engulfing candle on high volume. But notice how volumes have again diminished over the past three days whilst prices bounced higher, which suggests it is a retracement.
Tesla has fallen to 210.35 during post-market trade, which is just above the bearish engulfing low. We are therefore simply looking for a break below $204 (or $200 for a more conservative approach) to assume a bearish breakout, with $180 making a logical target for bears as it is near the March 2021 low.
Given the significance of the March 2021 low then there is a strong possibility it will initially act as support. But keeping the monthly chart and reversal pattern in mind, the bias is for an eventual break below $179.83.
How to trade with City Index
You can easily trade with City Index by using these four easy steps:
- Open an account, or log in if you’re already a customer
• Open an account in the UK
• Open an account in Australia
• Open an account in Singapore
- Search for the company you want to trade in our award-winning platform
- Choose your position and size, and your stop and limit levels
- Place the trade
How to trade with FOREX.com
Follow these easy steps to start trading with FOREX.com today:
- Open a Forex.com account, or log in if you’re already a customer.
- Search for the pair you want to trade in our award-winning platform.
- Choose your position and size, and your stop and limit levels.
- Place the trade.
Related tags:
Latest market news




The complete CFD trading experience
Award-winning platforms, competitive spreads, low commissions and dedicated support.
We live and breathe the markets and are dedicated to helping traders realise their ambitions as we continue to set the industry bar.
Economic calendar
Web Trader platform
Our sophisticated web-based platform is packed with features.
Related articles
US dollar outlook: Nasdaq breakdown raises stakes for EUR/USD, USD/JPY
A potential Democratic sweep of Congress is adding to the AI trade's headaches, with Nasdaq 100 futures breaking below a major technical level. The implications for the dollar could be significant.
US Dollar Short-term Outlook: USD Rally on the Line as Midterms, NFP Loom 11 3 2026
DXY is testing pivotal support, with the weekly range breakout likely to determine the next major leg of the trend as key event risk unfolds.

Nasdaq 100 forecast: Stocks rebound but AI concerns linger
The Nasdaq 100 was finding some support at 28,000 after recent sell-off amid concerns about the AI trade. Even with oscillators oversold, the risk to the near-term forecast is tilted to the downside.

StoneX Europe Ltd may make third party material available on this website which may contain information included but not limited to the conditions of financial markets. The material is for information purposes only and does not contain, and should not be construed as containing, investment advice and/or investment recommendation and/or an investment research and/or an offer of or solicitation for any transactions in financial instruments; any decision to enter into a specific transaction shall be made by the client following an assessment by him/her of their situation.
StoneX Europe Ltd makes no representation or warranty and assumes no liability as to the accuracy or completeness of the information provided, nor any loss arising from any investment based on a recommendation, forecast or other information supplied. You should always seek independent advice as to your suitability to speculate in any related markets and your ability to assume the associated risks, if you are at all unsure. We are not under any obligation to update any such material. Any opinion made may be personal to the author and may not reflect the opinion of StoneX Europe Ltd.