



The ‘Aw Shucks’ 200 braces itself for the open
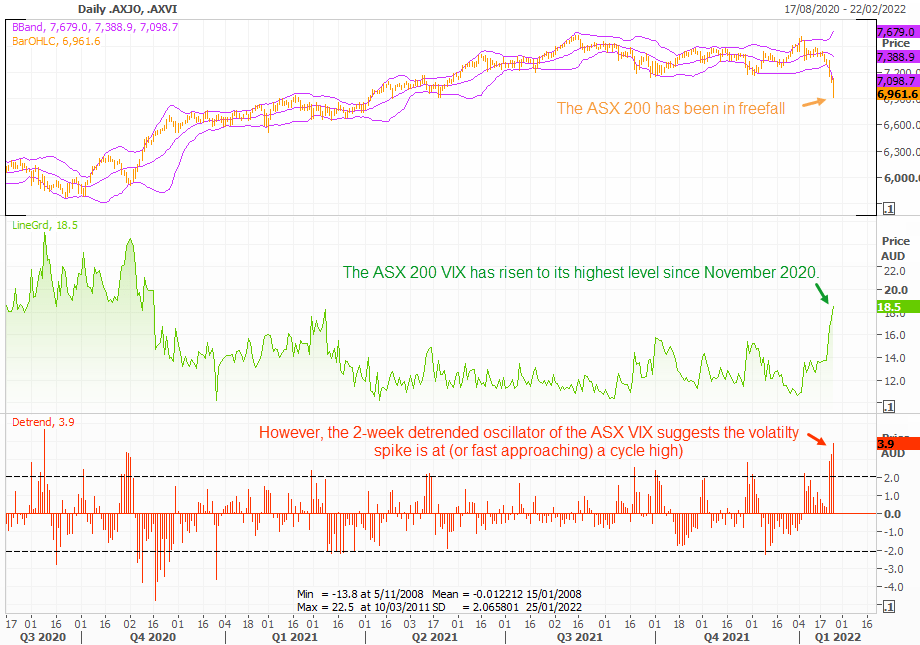
Whilst many were celebrating Australia day on Wednesday, investors were likely filled with trepidation given the ASX 200 was in free-fall leading into the public holiday.
Share this:

Read our guide on the ASX 200 trading guide
Read our ASX 200 trading guide
It has not been a good time to be long on the ASX 200. Since its YTD high, the index has fallen over 9%, half of which occurred over the past three sessions. Three of the past five days has seen the index fall over -1% in a day, two of which fell over -2%. Nice.


That said, the ASX is not alone as it has been swept along with a risk-off sentiment for equity traders globally. The Fed are set to hike rates several times this year and tensions between Russia and Ukraine persist which has been a large driver to the risk-off tone. Naturally this has seen the ASX 200 VIX (volatility index) and implied volatility exploder higher as investors rush for the exit and price in their worst fears.
Read our guide on the Volatility Index
Read our guide on the Volatility Inde?
As of Tuesday’s close, the ASX 200 VIX rose to an absolute level of 18.53 – a level not seen since November 2020. And this means that investors expect annualised volatility to reached 18.5% over the next 30-days. Yet perhaps the absolute level is not the best metric to assess near-term volatility. If we look at the 10-day detrended oscillator of the VIX it better shows the fluctuations of volatility cycle. And it currently suggests that the recent spike in volatility is at (or fast approaching) a cycle high.
Taking that into consideration, we are now questioning whether the worst of this leg lower is over, assuming it has not bottomed already. Of course, for any noteworthy turnaround we are going to need to see a rebound in global sentiment. And if this is the beginning of a bear market we also need to factor in the obligatory, volatile bounces during its white-knuckle ride. This means we are unsure whether any bounce could be of the dead-cat variety ahead of its next leg lower, or a v-bottom recovery. But as we highlight below, the ASX 200 has fallen sharpy into a key zone of support which may hold, at least initially.

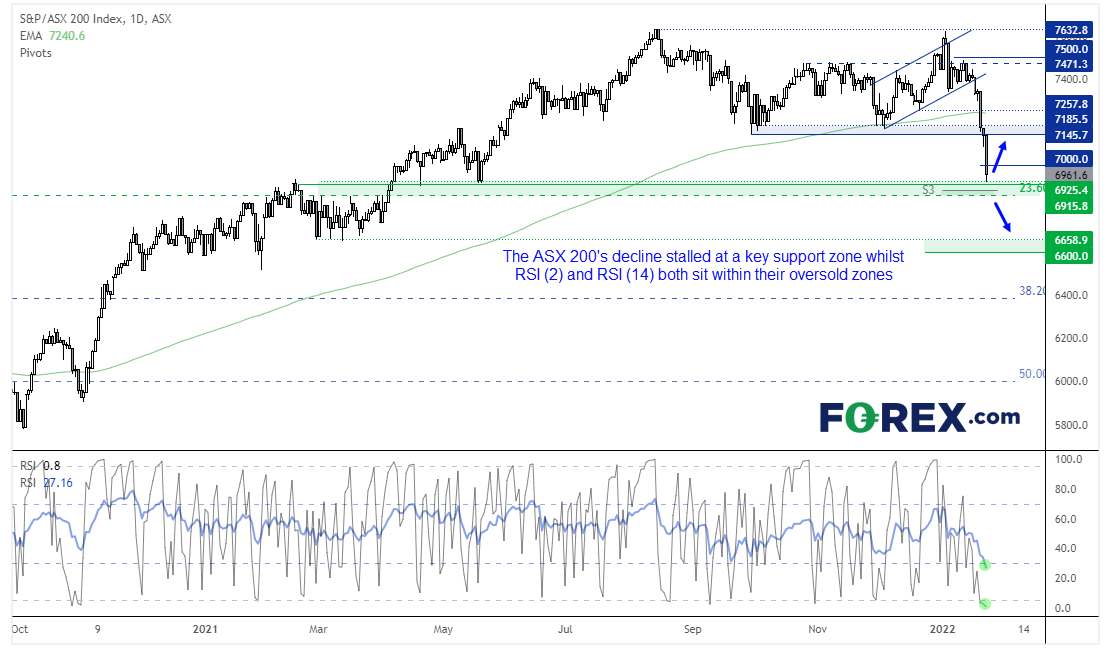
We can see on the daily chart that bearish momentum on the ASX 200 accelerated when prices broke beneath its 200-day eMA. Prices closed below 7,000 on Tuesday for the first time since May, further showing bears have having a picnic. Yet Friday’s low perfectly respected the 6925 support level, which is just above the monthly S3 pivot point and 23.8% Fibonacci retracement between the March 2020 low to all-time high. Furthermore, RSI (14) and RSI (2) are ‘oversold’. We use that term lightly because, due to the velocity of the bearish move, oscillators have nowhere else to be other than ‘oversold’. But the RSI (2) is 1.3, its most bearish level since March 2020, and this indicator setting is generally more reliable for producing oversold signals for quick fluctuations.
In a nutshell, we have technical clues that suggest the downside may be stretched over the near-term, coupled with a high reading on VIX (which is an indicator which generally does not stay high for long). If sentiment improves it could trigger a bounce from current levels yet, at the same time, we need to be on guard for a break lower of the support zone – which makes the zone around 6900 a pivotal level for traders to focus on for the remainder of the week.
How to trade with City Index
You can easily trade with City Index by using these four easy steps:
- Open an account, or log in if you’re already a customer
• Open an account in the UK
• Open an account in Australia
• Open an account in Singapore
- Search for the company you want to trade in our award-winning platform
- Choose your position and size, and your stop and limit levels
- Place the trade
How to trade with FOREX.com
Follow these easy steps to start trading with FOREX.com today:
- Open a Forex.com account, or log in if you’re already a customer.
- Search for the pair you want to trade in our award-winning platform.
- Choose your position and size, and your stop and limit levels.
- Place the trade.
Related tags:
Latest market news




The complete CFD trading experience
Award-winning platforms, competitive spreads, low commissions and dedicated support.
We live and breathe the markets and are dedicated to helping traders realise their ambitions as we continue to set the industry bar.
Economic calendar
Web Trader platform
Our sophisticated web-based platform is packed with features.
Related articles
Gold Q4 2026 outlook: Resilience in the face of rallying dollar and yields
As we headed towards the latter stages of Q3 and into Q4, the Fed had just hiked rates in a hawkish FOMC meeting, while the likes of the ECB and BoJ had also tightened their respective policies. Oil prices remained elevated amid the prolonged US-Iran conflict. Meanwhile, bond yields were breaking out, and the dollar was higher across the board. Yet, remarkably, gold was still holding in the positive territory for the third quarter, even if it had weakened somewhat in September.


Oil Quietly Hands the Fed a Reason to Stay Hawkish
Oil prices and the U.S. dollar are both on the front foot as elevated energy costs feed Fed warnings that inflation may prove sticky.

S&P 500 forecast: Stocks extend drop as correction risks grow
US and global equity markets have extended Wednesday’s sell-off, with Wall Street opening lower after a weak handover from Asia and Europe. The deterioration in risk appetite has been spreading across global markets. The dollar was firmer, Treasury yields were holding onto yesterday’s gains, while gold, silver and bitcoin were all under pressure alongside equities and major currencies.
StoneX Europe Ltd may make third party material available on this website which may contain information included but not limited to the conditions of financial markets. The material is for information purposes only and does not contain, and should not be construed as containing, investment advice and/or investment recommendation and/or an investment research and/or an offer of or solicitation for any transactions in financial instruments; any decision to enter into a specific transaction shall be made by the client following an assessment by him/her of their situation.
StoneX Europe Ltd makes no representation or warranty and assumes no liability as to the accuracy or completeness of the information provided, nor any loss arising from any investment based on a recommendation, forecast or other information supplied. You should always seek independent advice as to your suitability to speculate in any related markets and your ability to assume the associated risks, if you are at all unsure. We are not under any obligation to update any such material. Any opinion made may be personal to the author and may not reflect the opinion of StoneX Europe Ltd.