



This Weeks Big Earnings and Market Forecast
Is the S&P headed for a new high?
Share this:

On Tuesday, Walmart (WMT), the retail giant, is awaited to post second quarter EPS of $1.25 compared to $1.27 a year ago on revenue of $135 billion vs $130.4 billion last year. The expected move based on front-month options is 5.3%, the last time the Co reported earnings the stock declined 2.1%. Technically speaking, the RSI is above 70. It could mean either that the stock is in a lasting uptrend or just overbought and therefore bound to correct (look for bearish divergence in this case). The MACD is above its signal line and positive. The configuration is positive. Moreover, the stock is above its 20 and 50 day MA (respectively at 246.45 and 217.1).
Same day, Home Depot (HD), the home improvement specialty retailer, is likely to unveil second quarter EPS of $3.48 vs $3.17 last year on sales of $33.6 billion compared to $30.8 billion a year ago. The Co is also anticipated to move up or down by 5.3% based on options volatility. The Stock slid 3% after they last reported earnings. From a chartist's point of view, price remains supported by its 20-day moving average in an uptrend. The MACD is positive and above its signal line. The configuration is positive. Moreover, the stock is above its 20 and 50 day MA (respectively at 265.72 and 255.71).
On Wednesday, Nvidia (NVDA), a leading designer of graphics processors, is expected to announce second quarter EPS of $1.97 compared to $1.24 a year ago on revenue of $3.6 billion vs $2.6 billion last year. Traders are anticipating a move around 9.4%. The stock gained 2.9% after last earnings were reported. From a technical point of view, the RSI is above its neutrality area at 50. The MACD is above its signal line and positive. The configuration is positive. Moreover, the stock is trading above both its 20 and 50 day MA (respectively at 427.57 and 397.93).
Same day, Target (TGT), a leading general merchandise discount retailer is anticipated to release second quarter EPS of $1.48 vs $1.82 last year on sales of $19.4 billion compared to $18.4 Billion a year ago. Target may move 6.8% on earnings compared to a drop of 2.9% after Q1. Looking at a daily chart, the stock broke above key resistance at 128.6 that has now become support. An uptrend may be in play. The MACD is above its signal line and positive. The configuration is positive. Moreover, the stock is above its 20 and 50 day MA (respectively at 124.74 and 121.51).
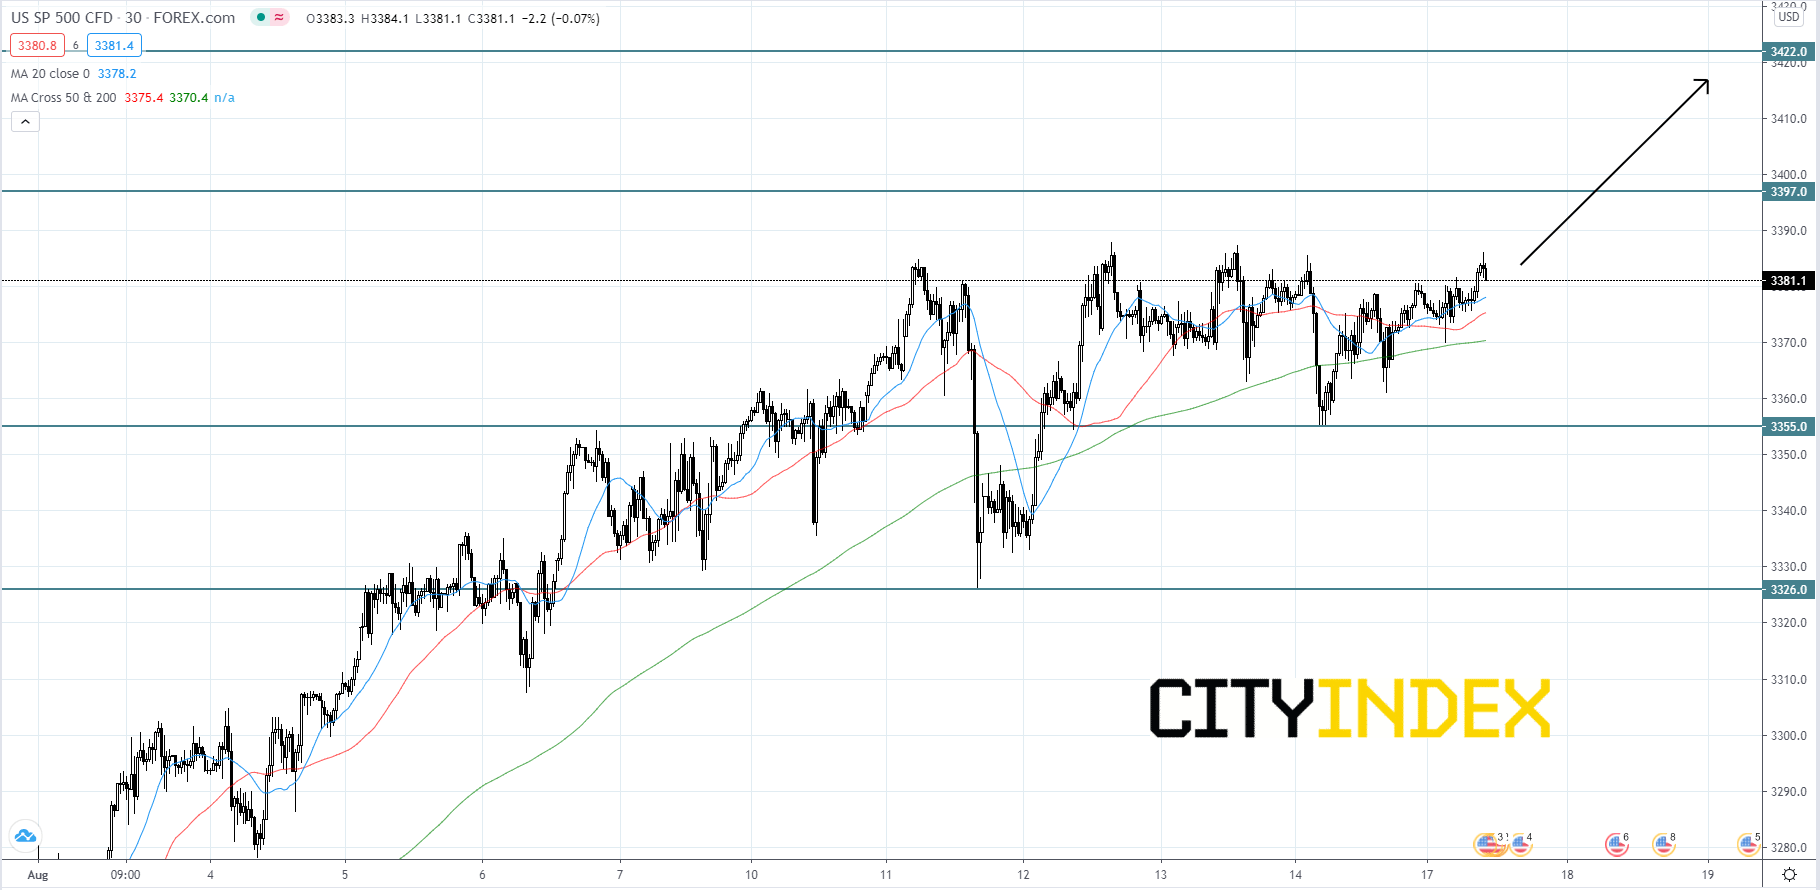
Looking at the S&P 500 CFD on a 30 minute chart, the index has continued to rise and is currently holding just below its all time high of 3397.00. The index will likely chop around before attempting to retest the 3397.00 level. If price reaches and breaks the record high, the index will probably continue upwards to 3422.00. Even if the index pulls back we could see a bounce off of 3355.00 or 3326.00.
Source: GAIN Capital, TradingView
Same day, Home Depot (HD), the home improvement specialty retailer, is likely to unveil second quarter EPS of $3.48 vs $3.17 last year on sales of $33.6 billion compared to $30.8 billion a year ago. The Co is also anticipated to move up or down by 5.3% based on options volatility. The Stock slid 3% after they last reported earnings. From a chartist's point of view, price remains supported by its 20-day moving average in an uptrend. The MACD is positive and above its signal line. The configuration is positive. Moreover, the stock is above its 20 and 50 day MA (respectively at 265.72 and 255.71).
On Wednesday, Nvidia (NVDA), a leading designer of graphics processors, is expected to announce second quarter EPS of $1.97 compared to $1.24 a year ago on revenue of $3.6 billion vs $2.6 billion last year. Traders are anticipating a move around 9.4%. The stock gained 2.9% after last earnings were reported. From a technical point of view, the RSI is above its neutrality area at 50. The MACD is above its signal line and positive. The configuration is positive. Moreover, the stock is trading above both its 20 and 50 day MA (respectively at 427.57 and 397.93).
Same day, Target (TGT), a leading general merchandise discount retailer is anticipated to release second quarter EPS of $1.48 vs $1.82 last year on sales of $19.4 billion compared to $18.4 Billion a year ago. Target may move 6.8% on earnings compared to a drop of 2.9% after Q1. Looking at a daily chart, the stock broke above key resistance at 128.6 that has now become support. An uptrend may be in play. The MACD is above its signal line and positive. The configuration is positive. Moreover, the stock is above its 20 and 50 day MA (respectively at 124.74 and 121.51).
Looking at the S&P 500 CFD on a 30 minute chart, the index has continued to rise and is currently holding just below its all time high of 3397.00. The index will likely chop around before attempting to retest the 3397.00 level. If price reaches and breaks the record high, the index will probably continue upwards to 3422.00. Even if the index pulls back we could see a bounce off of 3355.00 or 3326.00.
Source: GAIN Capital, TradingView
On Tuesday, Walmart (WMT), the retail giant, is awaited to post second quarter EPS of $1.25 compared to $1.27 a year ago on revenue of $135 billion vs $130.4 billion last year. The expected move based on front-month options is 5.3%, the last time the Co reported earnings the stock declined 2.1%. Technically speaking, the RSI is above 70. It could mean either that the stock is in a lasting uptrend or just overbought and therefore bound to correct (look for bearish divergence in this case). The MACD is above its signal line and positive. The configuration is positive. Moreover, the stock is above its 20 and 50 day MA (respectively at 246.45 and 217.1).
Same day, Home Depot (HD), the home improvement specialty retailer, is likely to unveil second quarter EPS of $3.48 vs $3.17 last year on sales of $33.6 billion compared to $30.8 billion a year ago. The Co is also anticipated to move up or down by 5.3% based on options volatility. The Stock slid 3% after they last reported earnings. From a chartist's point of view, price remains supported by its 20-day moving average in an uptrend. The MACD is positive and above its signal line. The configuration is positive. Moreover, the stock is above its 20 and 50 day MA (respectively at 265.72 and 255.71).
On Wednesday, Nvidia (NVDA), a leading designer of graphics processors, is expected to announce second quarter EPS of $1.97 compared to $1.24 a year ago on revenue of $3.6 billion vs $2.6 billion last year. Traders are anticipating a move around 9.4%. The stock gained 2.9% after last earnings were reported. From a technical point of view, the RSI is above its neutrality area at 50. The MACD is above its signal line and positive. The configuration is positive. Moreover, the stock is trading above both its 20 and 50 day MA (respectively at 427.57 and 397.93).
Same day, Target (TGT), a leading general merchandise discount retailer is anticipated to release second quarter EPS of $1.48 vs $1.82 last year on sales of $19.4 billion compared to $18.4 Billion a year ago. Target may move 6.8% on earnings compared to a drop of 2.9% after Q1. Looking at a daily chart, the stock broke above key resistance at 128.6 that has now become support. An uptrend may be in play. The MACD is above its signal line and positive. The configuration is positive. Moreover, the stock is above its 20 and 50 day MA (respectively at 124.74 and 121.51).
Looking at the S&P 500 CFD on a 30 minute chart, the index has continued to rise and is currently holding just below its all time high of 3397.00. The index will likely chop around before attempting to retest the 3397.00 level. If price reaches and breaks the record high, the index will probably continue upwards to 3422.00. Even if the index pulls back we could see a bounce off of 3355.00 or 3326.00.

Source: GAIN Capital, TradingView
Latest market news




The complete CFD trading experience
Award-winning platforms, competitive spreads, low commissions and dedicated support.
We live and breathe the markets and are dedicated to helping traders realise their ambitions as we continue to set the industry bar.
Economic calendar
Web Trader platform
Our sophisticated web-based platform is packed with features.
Related articles

S&P 500 forecast: Stocks extend drop as correction risks grow
US and global equity markets have extended Wednesday’s sell-off, with Wall Street opening lower after a weak handover from Asia and Europe. The deterioration in risk appetite has been spreading across global markets. The dollar was firmer, Treasury yields were holding onto yesterday’s gains, while gold, silver and bitcoin were all under pressure alongside equities and major currencies.


Nikkei threatens breakout as tech rebound broadens
Breakouts across the SOX and Nasdaq are being matched by rebounds across Asia, with the Nikkei now threatening to join the move.

Nasdaq 100 Forecast: Confidence Returns as the Index Challenges Record Highs
The trading week is getting underway with renewed bullish momentum across Nasdaq. This is reflected in today's session, where the index has gained more than 2.5%, highlighting a buying bias that has not been observed with this level of strength in several weeks.

StoneX Europe Ltd may make third party material available on this website which may contain information included but not limited to the conditions of financial markets. The material is for information purposes only and does not contain, and should not be construed as containing, investment advice and/or investment recommendation and/or an investment research and/or an offer of or solicitation for any transactions in financial instruments; any decision to enter into a specific transaction shall be made by the client following an assessment by him/her of their situation.
StoneX Europe Ltd makes no representation or warranty and assumes no liability as to the accuracy or completeness of the information provided, nor any loss arising from any investment based on a recommendation, forecast or other information supplied. You should always seek independent advice as to your suitability to speculate in any related markets and your ability to assume the associated risks, if you are at all unsure. We are not under any obligation to update any such material. Any opinion made may be personal to the author and may not reflect the opinion of StoneX Europe Ltd.