





Trade Talk Sentiment Supports The Kiwi
Share this:

Optimism surrounding trade talks and Brexit has weighed on the dollar, providing a reprieve for some arguably oversold commodity currencies.
As noted by my colleague Fawad Razaqzada, AUD/USD is on the cusp of printing a bullish hammer on the weekly chart, helped by improved trade sentiment and less demand for the US dollar. However, it’s also had a positive effect on commodity currencies NZD and CAD, with the Kiwi dollar close to confirming a bullish reversal pattern, despite printing weak electronic retail sales and a third month of contracting manufacturing PMI. Of course, if data is to improve alongside US-China trade relations, we’d expect further upside. Whilst we remain hesitant to suggest a trade deal is close, we see the potential reversal on NZD/USD as a corrective move as opposed t a full trend reversal.
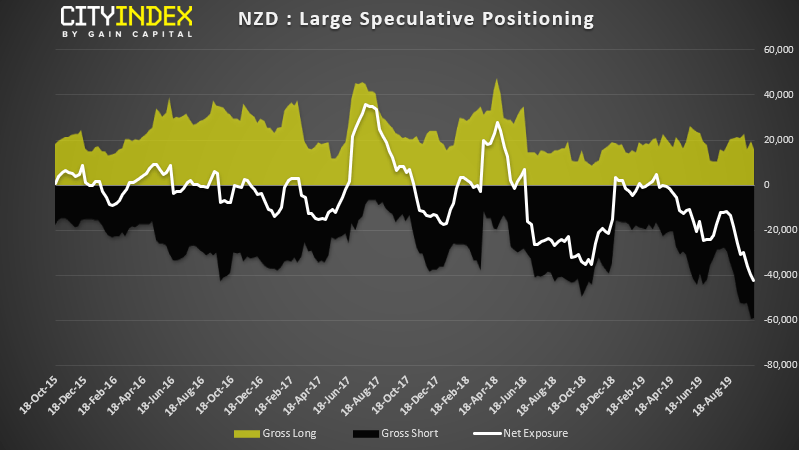
On the 30th of September we noted the potential for a reversal on NZD/USD, due to extreme market positioning. “NZD is at high risk of a sentiment extreme so could be vulnerable to a bullish rally if economic data allows. With many kiwi crosses looking overstretched to the downside, we’ll be keeping a close eye on the potential for bases to form”. With gross-short ant net-short poisoning sat at fresh record highs and the 3-year Z-score at -3.8, the odds of bearish capitulation has only increased. So we’re watching price action very closely as it could be on the cusp of confirming a bullish reversal pattern.
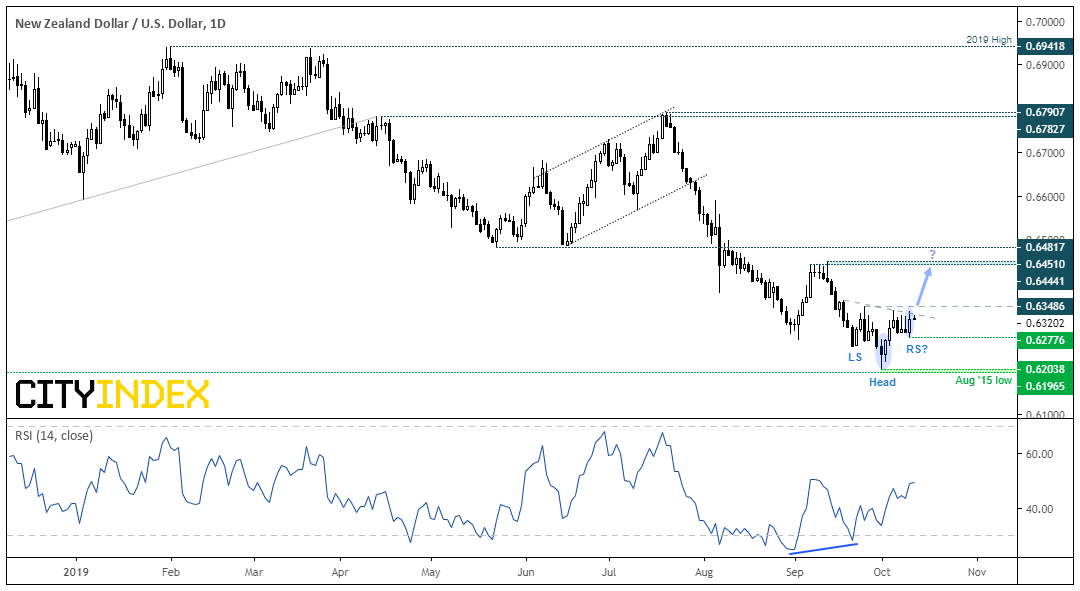
On the 1st of October, NZD/USD found itself at a 4-year low. Yet it’s failure to test the August 2015 low produced a spinning top doji just above key support, and the subsequent bullish engulfing candle provided a two-bear reversal pattern. Not only did this coincide with a bullish divergence with the RSI, but the -bar reversal pattern could be the ‘head’ of an inverted head and shoulders pattern. Yesterday’s bullish engulfing candle suggests the right shoulder (RS) is being formed so, if we’re to see a break above the neckline, we’d assume the bullish reversal pattern to be confirmed.
- A break above the neckline confirms an inverted head and shoulders pattern which, if successful, projects an initial target around 0.6450.
- Traders may want to wait for a break of 0.6350 for extra confirmation of a breakout.
- A minor break below 0.6277 (RS) doesn’t necessarily invalidate the potential pattern, but we could use a volatile break beneath it to step aside or reconsider bearish setups in line with the dominant trend.
- The daily trade remains bearish below 0.6451, so the inverted head and shoulders pattern is assumed to be part of a correction as opposed to trend reversal for now,
Related analysis:
AUD/USD in focus amid US-China trade talks and ahead of US CPI
GBP Higher as Brexit Rules
Market Brief: Optimism Over Potential Brexit and US-China Deals Rules the Day

Optimism surrounding trade talks and Brexit has weighed on the dollar, providing a reprieve for some arguably oversold commodity currencies.
As noted by my colleague Fawad Razaqzada, AUD/USD is on the cusp of printing a bullish hammer on the weekly chart, helped by improved trade sentiment and less demand for the US dollar. However, it’s also had a positive effect on commodity currencies NZD and CAD, with the Kiwi dollar close to confirming a bullish reversal pattern, despite printing weak electronic retail sales and a third month of contracting manufacturing PMI. Of course, if data is to improve alongside US-China trade relations, we’d expect further upside. Whilst we remain hesitant to suggest a trade deal is close, we see the potential reversal on NZD/USD as a corrective move as opposed t a full trend reversal.
On the 30th of September we noted the potential for a reversal on NZD/USD, due to extreme market positioning. “NZD is at high risk of a sentiment extreme so could be vulnerable to a bullish rally if economic data allows. With many kiwi crosses looking overstretched to the downside, we’ll be keeping a close eye on the potential for bases to form”. With gross-short ant net-short poisoning sat at fresh record highs and the 3-year Z-score at -3.8, the odds of bearish capitulation has only increased. So we’re watching price action very closely as it could be on the cusp of confirming a bullish reversal pattern.
On the 1st of October, NZD/USD found itself at a 4-year low. Yet it’s failure to test the August 2015 low produced a spinning top doji just above key support, and the subsequent bullish engulfing candle provided a two-bear reversal pattern. Not only did this coincide with a bullish divergence with the RSI, but the -bar reversal pattern could be the ‘head’ of an inverted head and shoulders pattern. Yesterday’s bullish engulfing candle suggests the right shoulder (RS) is being formed so, if we’re to see a break above the neckline, we’d assume the bullish reversal pattern to be confirmed.
- A break above the neckline confirms an inverted head and shoulders pattern which, if successful, projects an initial target around 0.6450.
- Traders may want to wait for a break of 0.6350 for extra confirmation of a breakout.
- A minor break below 0.6277 (RS) doesn’t necessarily invalidate the potential pattern, but we could use a volatile break beneath it to step aside or reconsider bearish setups in line with the dominant trend.
- The daily trade remains bearish below 0.6451, so the inverted head and shoulders pattern is assumed to be part of a correction as opposed to trend reversal for now,
Related analysis:
AUD/USD in focus amid US-China trade talks and ahead of US CPI
GBP Higher as Brexit Rules
Market Brief: Optimism Over Potential Brexit and US-China Deals Rules the Day
Related tags:
Latest market news




The complete CFD trading experience
Award-winning platforms, competitive spreads, low commissions and dedicated support.
We live and breathe the markets and are dedicated to helping traders realise their ambitions as we continue to set the industry bar.
Economic calendar
Web Trader platform
Our sophisticated web-based platform is packed with features.
Related articles
EUR/USD Q4 2026 Outlook: Euro at a Crossroads as Fed, ECB Tighten 9 25 2026
EUR/USD enters Q4 at a pivotal inflection point as competing Fed-ECB policy paths and persistent inflation risks collide with major technical support.

USD/JPY Q4 2026 Outlook: Hawkish Fed Pricing Clashes With Intervention Risk
The year-end tug-of-war is clear: hawkish Fed pricing supports USD/JPY, while intervention risk limits the upside.


Japanese Yen Forecast: USD/JPY 4% Rally Challenges Post-Intervention Downtrend 9 24 2026
USD/JPY momentum has shifted sharply higher, putting a major resistance confluence in focus as U.S. and Japanese event risk builds.
StoneX Europe Ltd may make third party material available on this website which may contain information included but not limited to the conditions of financial markets. The material is for information purposes only and does not contain, and should not be construed as containing, investment advice and/or investment recommendation and/or an investment research and/or an offer of or solicitation for any transactions in financial instruments; any decision to enter into a specific transaction shall be made by the client following an assessment by him/her of their situation.
StoneX Europe Ltd makes no representation or warranty and assumes no liability as to the accuracy or completeness of the information provided, nor any loss arising from any investment based on a recommendation, forecast or other information supplied. You should always seek independent advice as to your suitability to speculate in any related markets and your ability to assume the associated risks, if you are at all unsure. We are not under any obligation to update any such material. Any opinion made may be personal to the author and may not reflect the opinion of StoneX Europe Ltd.