




Two trades to watch FTSE US Dollar Index
FTSE gains on commodity rally, HSBC results. US Dollar Index searches for direction ahead of Fed Chair Jerome Powell's testimony.
Share this:

FTSE gains on commodity rally, HSBC results
FTSE is on the rise, helped by a rally in commodities as base metals rise on the back of global recovery hopes and supply challenges.
HSBC posted better than expected earnings.
UK unemployment 5.1% in 3 months to December. Claimant Count -20k vs +35k exp. Average earnings 4.7% vs 3.7% Nov & 4.2% expected. The stronger pound could limit gains on FTSE.
Where next for the FTSE?
The FTSE is rebounding after falling lower in the previous session. It trades +0.3% at the time of writing The price picked up off the ascending trendline support on Monday. However, the RSI is neutral at 50 and the 200 & 50 sma are flat indicating a neutral bias.
The price is currently testing the 50 & 200 sma on the 4 hour chart at 6640.
A break above this level could bring resistance at 6750 into play high 18th February ahead of February’s high at 6800.
Should the price fail to break above the 50 & 200 sma the price could fall back to 6590 the ascending trendline support before testing 6545 the low from 22nd Feb.
Learn more about trading indices

US Dollar looks for direction ahead of Fed Jerome Powell’s testimony
US Dollar looks for direction ahead of Fed Jerome Powell’s testimony
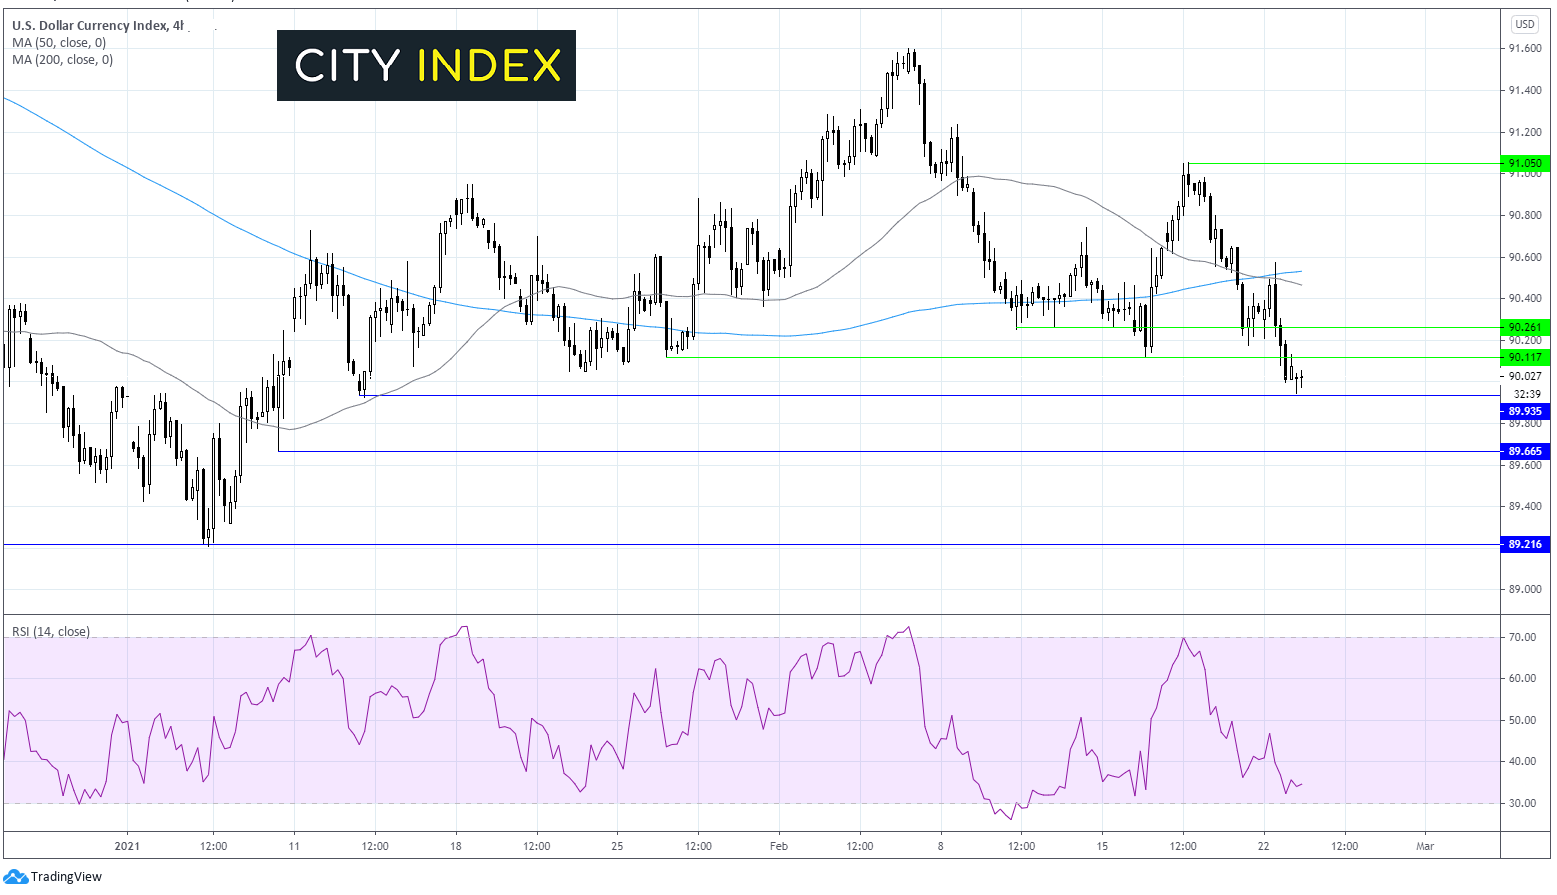
After three days of losses the index is challenging support at the psychological level of 90.00
The reflation trade dominates market sentiment helped by the strong vaccine rollout and optimism surrounding a strong economic recovery.
Although the DXY appears to have ignored rising yields which hit 1.40% for first time in a year.
Attention turnsto Fed Jerome Powell's bi-annual testimony before Congress.
Where next for the US Dollar Index?
The US Dollar is attempting to recover from a pullback overnight to a low of 89.94 in the Asian session.
It trades below its 50 & 200 sma, the 50 sma crossed below the 200 sma in a bearish signal and the RSI is also supportive of further losses until it reaches oversold territory.
Today’s low of 89.94 and January 13th low of 89.92 offers immediate support and could prevent further losses in the DXY. Beyond here 89.70 low 8th January could also offer support. A move through here to 89.20 the yearly low can’t be ruled out.
Any attempt at a rebound would need the bulls to break through horizontal resistance at 90.11, support turned resistance (26th January / 16th February). A break through this level could see 90.25 support turned resistance from early Feb pressurize the bulls ahead of the 200 sma on the 4 hour chart at 90.55.
Learn more about trading forex.
Learn more about the Federal Reserve
FTSE gains on commodity rally, HSBC results
FTSE is on the rise, helped by a rally in commodities as base metals rise on the back of global recovery hopes and supply challenges.
HSBC posted better than expected earnings.
UK unemployment 5.1% in 3 months to December. Claimant Count -20k vs +35k exp. Average earnings 4.7% vs 3.7% Nov & 4.2% expected. The stronger pound could limit gains on FTSE.
Where next for the FTSE?
The FTSE is rebounding after falling lower in the previous session. It trades +0.3% at the time of writing The price picked up off the ascending trendline support on Monday. However, the RSI is neutral at 50 and the 200 & 50 sma are flat indicating a neutral bias.
The price is currently testing the 50 & 200 sma on the 4 hour chart at 6640.
A break above this level could bring resistance at 6750 into play high 18th February ahead of February’s high at 6800.
Should the price fail to break above the 50 & 200 sma the price could fall back to 6590 the ascending trendline support before testing 6545 the low from 22nd Feb.
Learn more about trading indices

US Dollar looks for direction ahead of Fed Jerome Powell’s testimony
US Dollar looks for direction ahead of Fed Jerome Powell’s testimony
After three days of losses the index is challenging support at the psychological level of 90.00
The reflation trade dominates market sentiment helped by the strong vaccine rollout and optimism surrounding a strong economic recovery.
Although the DXY appears to have ignored rising yields which hit 1.40% for first time in a year.
Attention turnsto Fed Jerome Powell's bi-annual testimony before Congress.
Where next for the US Dollar Index?
The US Dollar is attempting to recover from a pullback overnight to a low of 89.94 in the Asian session.
It trades below its 50 & 200 sma, the 50 sma crossed below the 200 sma in a bearish signal and the RSI is also supportive of further losses until it reaches oversold territory.
Today’s low of 89.94 and January 13th low of 89.92 offers immediate support and could prevent further losses in the DXY. Beyond here 89.70 low 8th January could also offer support. A move through here to 89.20 the yearly low can’t be ruled out.
Any attempt at a rebound would need the bulls to break through horizontal resistance at 90.11, support turned resistance (26th January / 16th February). A break through this level could see 90.25 support turned resistance from early Feb pressurize the bulls ahead of the 200 sma on the 4 hour chart at 90.55.
Learn more about trading forex.
Learn more about the Federal Reserve
Latest market news




The complete CFD trading experience
Award-winning platforms, competitive spreads, low commissions and dedicated support.
We live and breathe the markets and are dedicated to helping traders realise their ambitions as we continue to set the industry bar.
Economic calendar
Web Trader platform
Our sophisticated web-based platform is packed with features.
Related articles
EUR/USD Q4 2026 Outlook: Euro at a Crossroads as Fed, ECB Tighten 9 25 2026
EUR/USD enters Q4 at a pivotal inflection point as competing Fed-ECB policy paths and persistent inflation risks collide with major technical support.

USD/JPY Q4 2026 Outlook: Hawkish Fed Pricing Clashes With Intervention Risk
The year-end tug-of-war is clear: hawkish Fed pricing supports USD/JPY, while intervention risk limits the upside.


Japanese Yen Forecast: USD/JPY 4% Rally Challenges Post-Intervention Downtrend 9 24 2026
USD/JPY momentum has shifted sharply higher, putting a major resistance confluence in focus as U.S. and Japanese event risk builds.
StoneX Europe Ltd may make third party material available on this website which may contain information included but not limited to the conditions of financial markets. The material is for information purposes only and does not contain, and should not be construed as containing, investment advice and/or investment recommendation and/or an investment research and/or an offer of or solicitation for any transactions in financial instruments; any decision to enter into a specific transaction shall be made by the client following an assessment by him/her of their situation.
StoneX Europe Ltd makes no representation or warranty and assumes no liability as to the accuracy or completeness of the information provided, nor any loss arising from any investment based on a recommendation, forecast or other information supplied. You should always seek independent advice as to your suitability to speculate in any related markets and your ability to assume the associated risks, if you are at all unsure. We are not under any obligation to update any such material. Any opinion made may be personal to the author and may not reflect the opinion of StoneX Europe Ltd.