





US dollar surges as US short-term yields hit 22-month highs
It’s clear that investors are more confident than ever that the Federal Reserve will seek to “normalize” monetary policy in 2022, paving the way for US dollar strength
Share this:

As traders trickle back to their desks to start another year, there’s one market move dwarfing all others: The US dollar is trouncing its major rivals. The chart below highlights the move, with the so-called commodity dollars (the Canadian, New Zealand, and Australian dollar) bearing the brunt of the selling (for more on USD/CAD, see my colleague Joe Perry’s Currency Pair of the Week article):
Source: FinViz
So what’s driving the big move in the greenback?
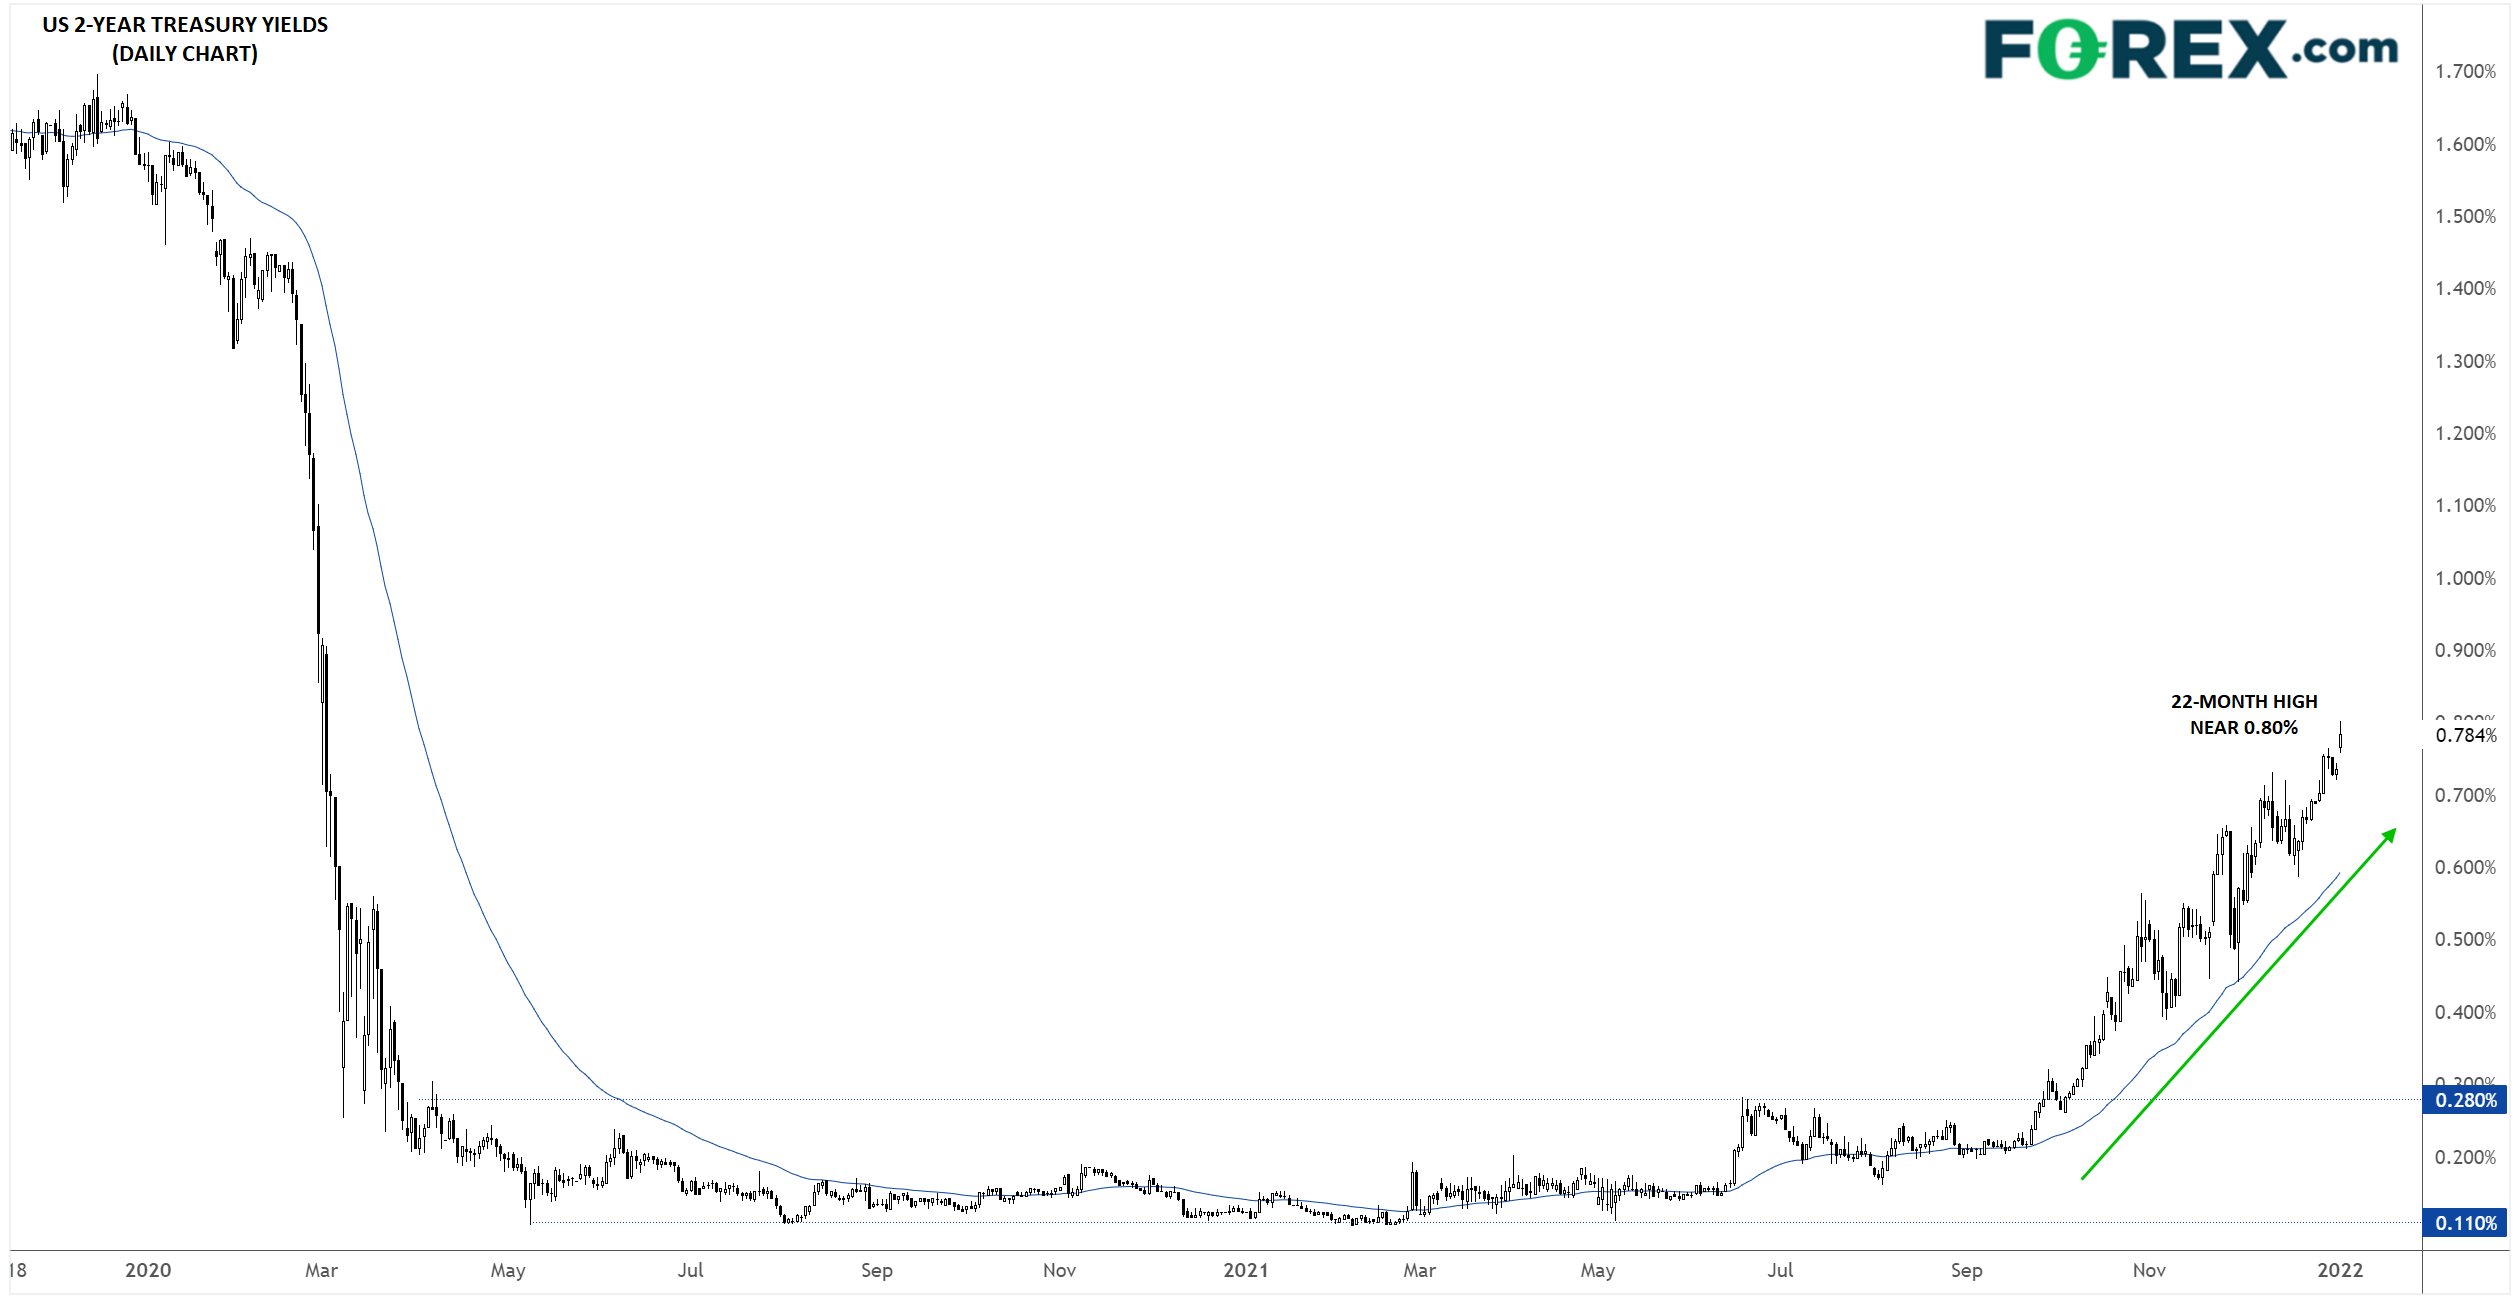
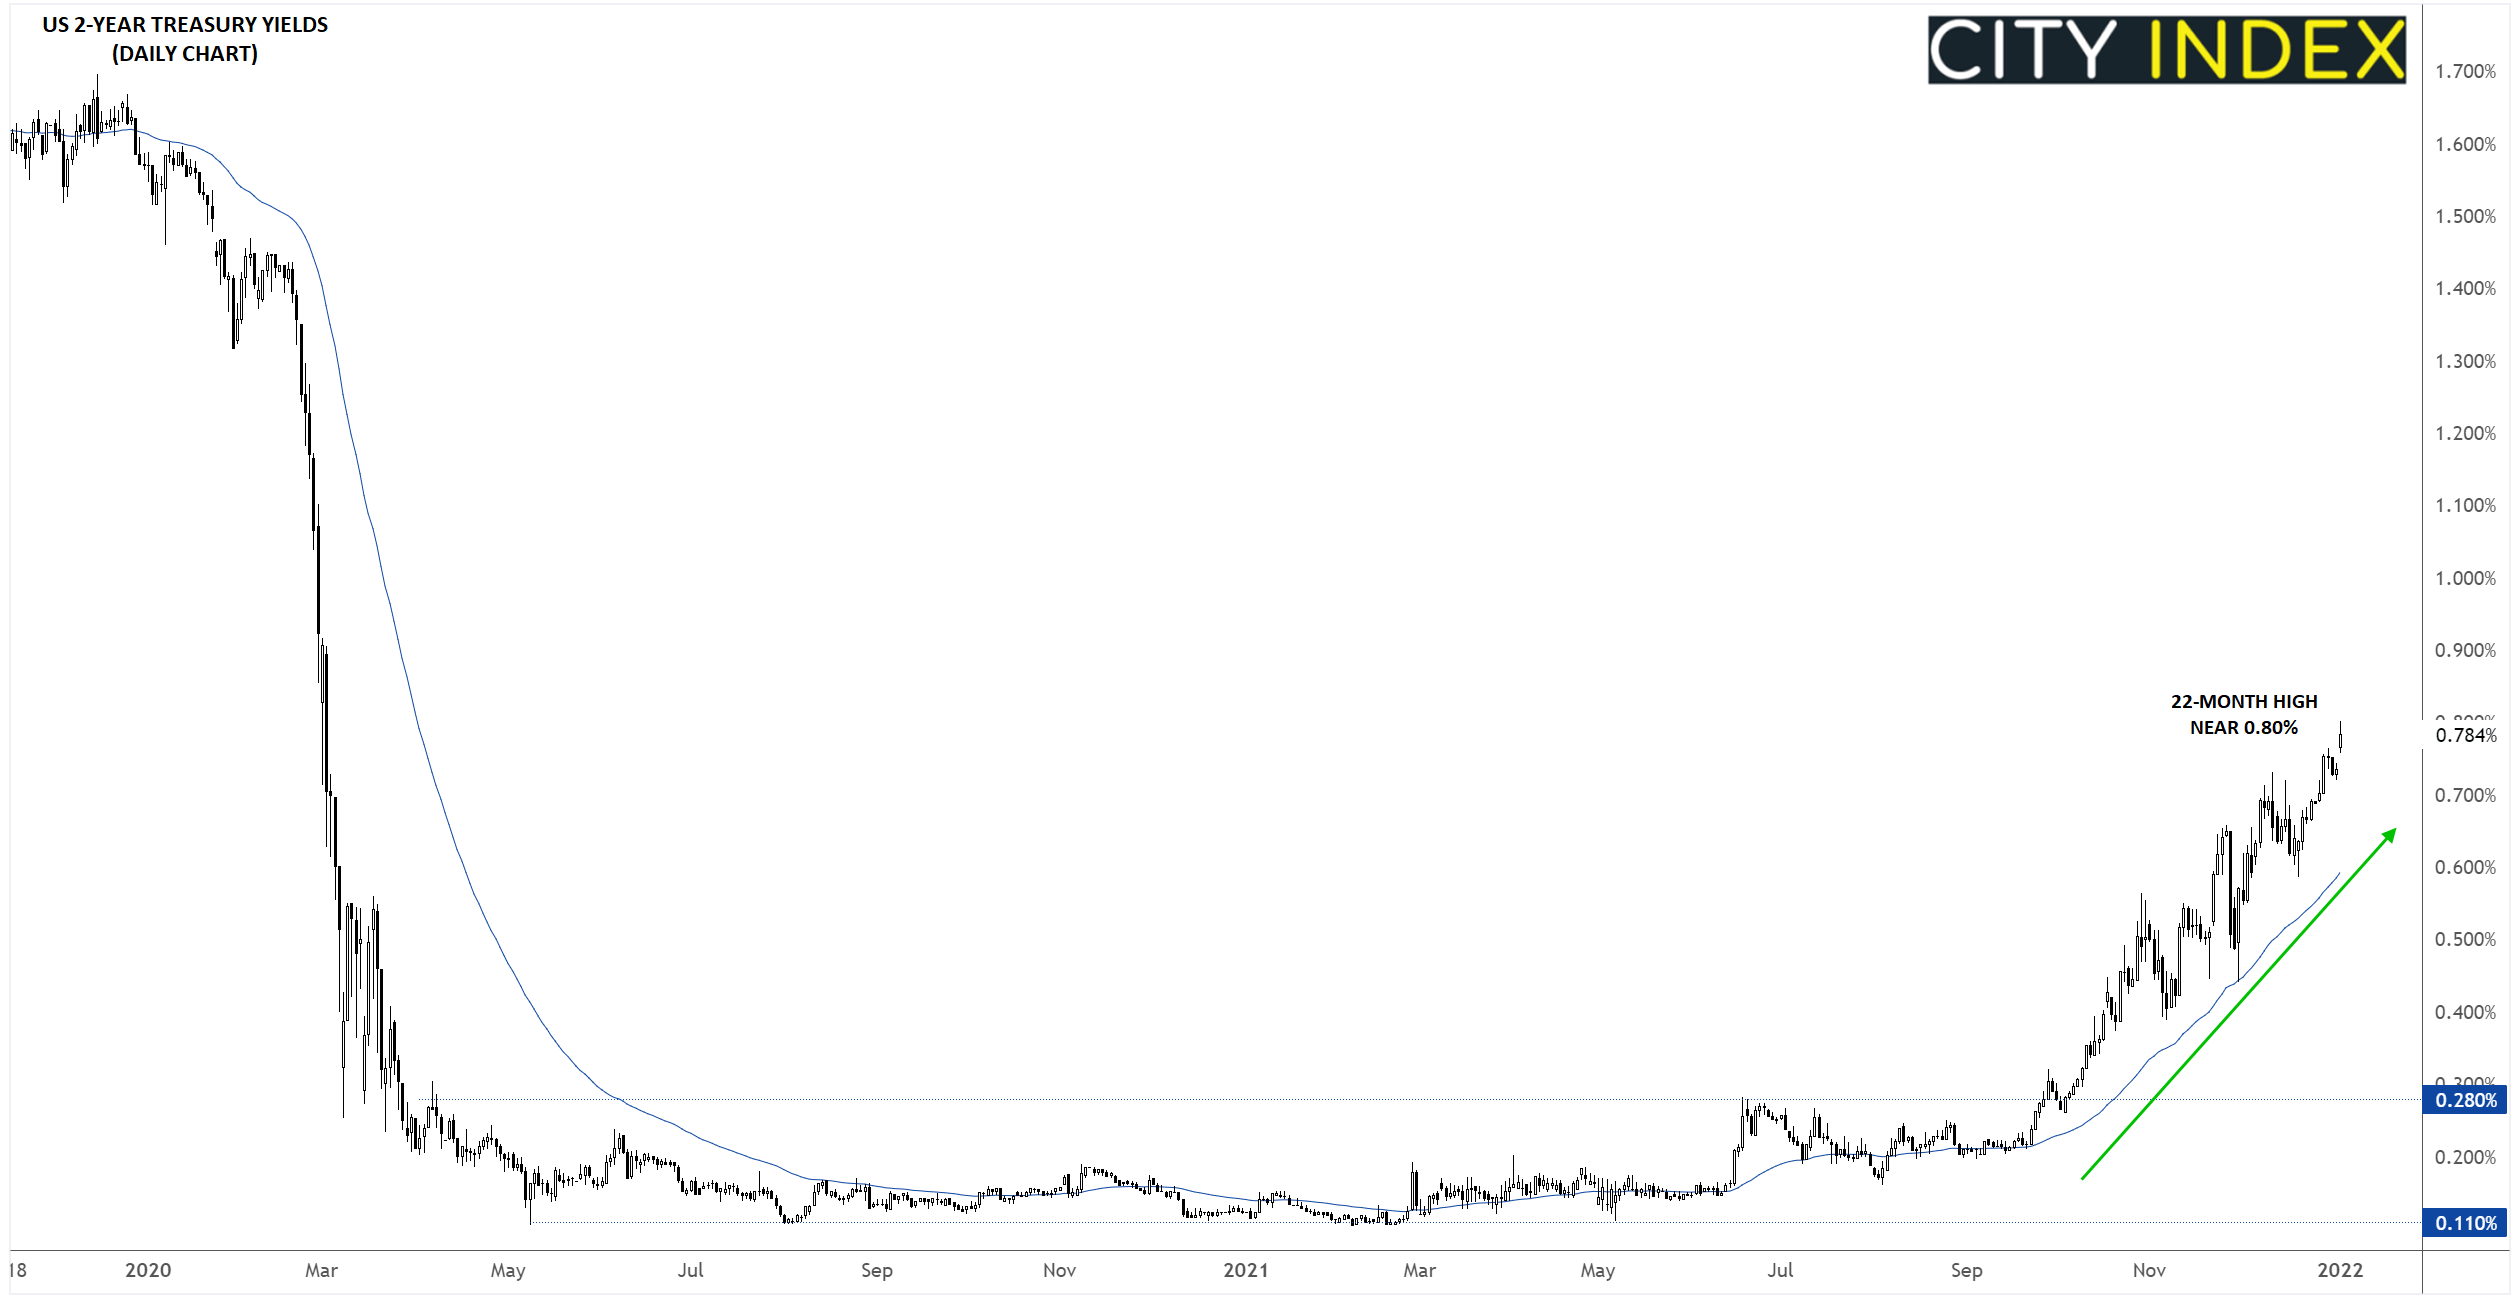
As always, one of the strongest cross-market correlations is between short-term interest rates and currencies. As the chart below shows, the 2-year US Treasury yield is trading up 5bps already today to its highest level since the start of the pandemic 22 months ago:
Source: Tradingview, StoneX
While we haven’t necessarily gotten any new “news” on the outlook for interest rates, it’s clear that investors are more confident than ever that the Federal Reserve will seek to “normalize” monetary policy in 2022. As a reminder, the median Fed voter has indicated that he/she expects 3 interest rate hikes this year, and two-thirds (12/18) of members anticipate at least that many rate increases.
On that note, the economic calendar will be ramping up throughout the next couple of weeks, with both traders and policymakers keen for the latest ISM surveys (Manufacturing tomorrow and Services on Thursday), readings on the labor market (ADP on Wednesday and NFP on Friday), inflation figures (CPI next Wednesday and PPI next Thursday), and retail sales (next Friday) out of the US.
Technical view: US Dollar Index (DXY)
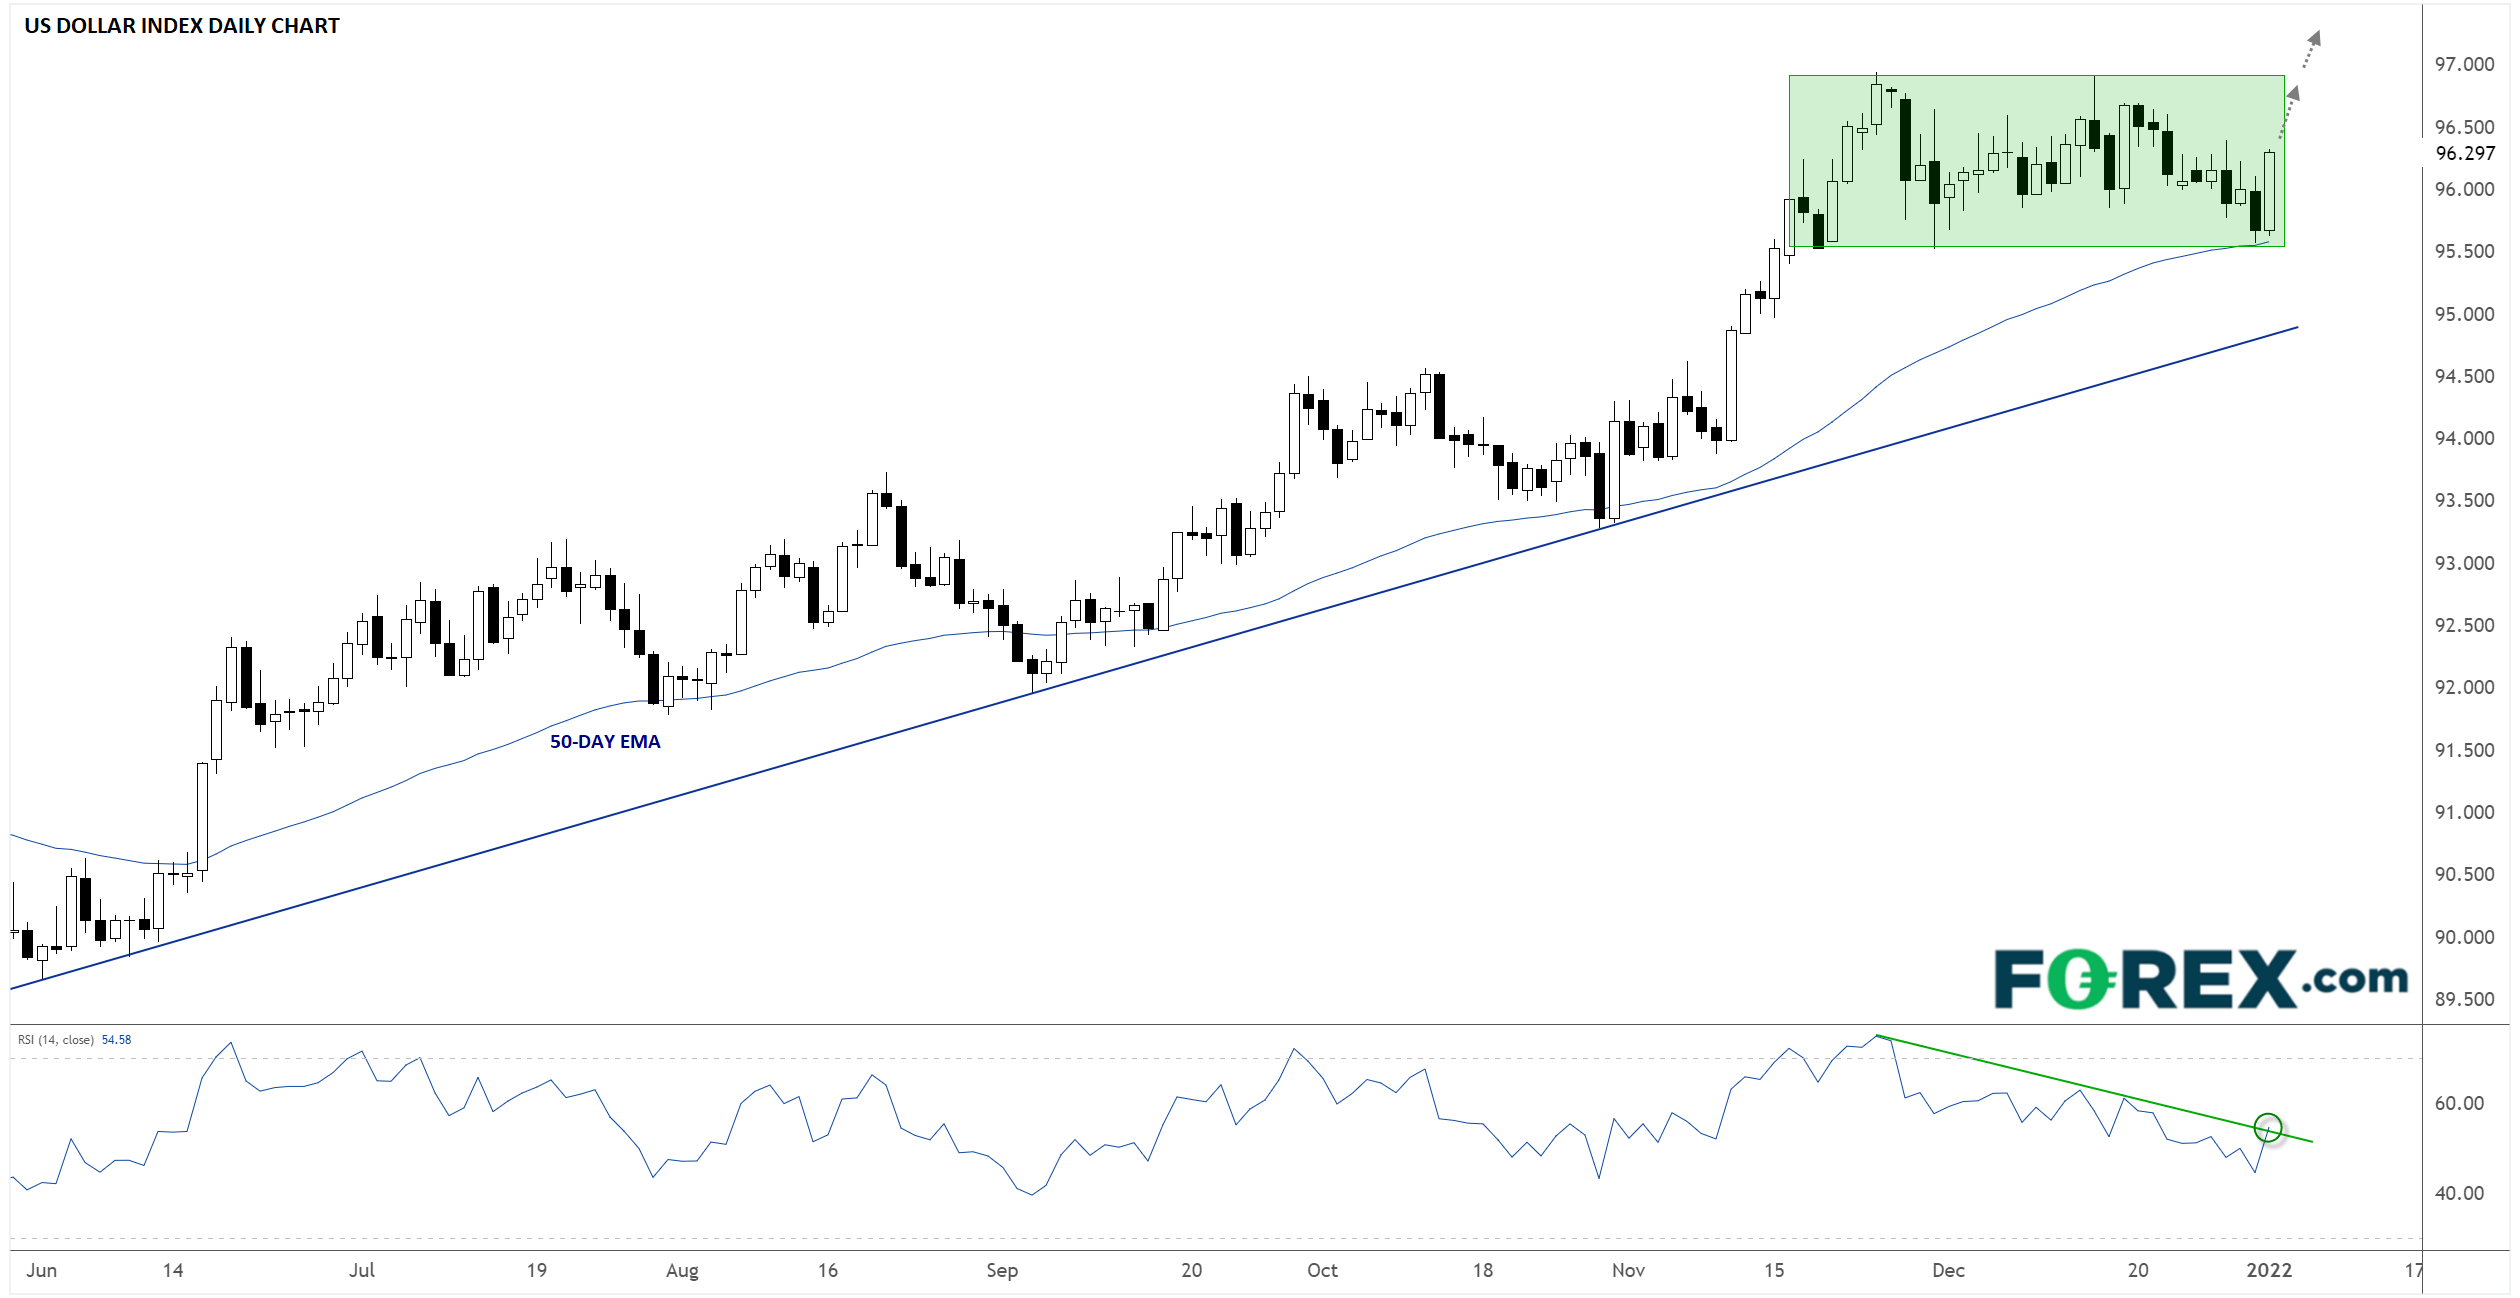
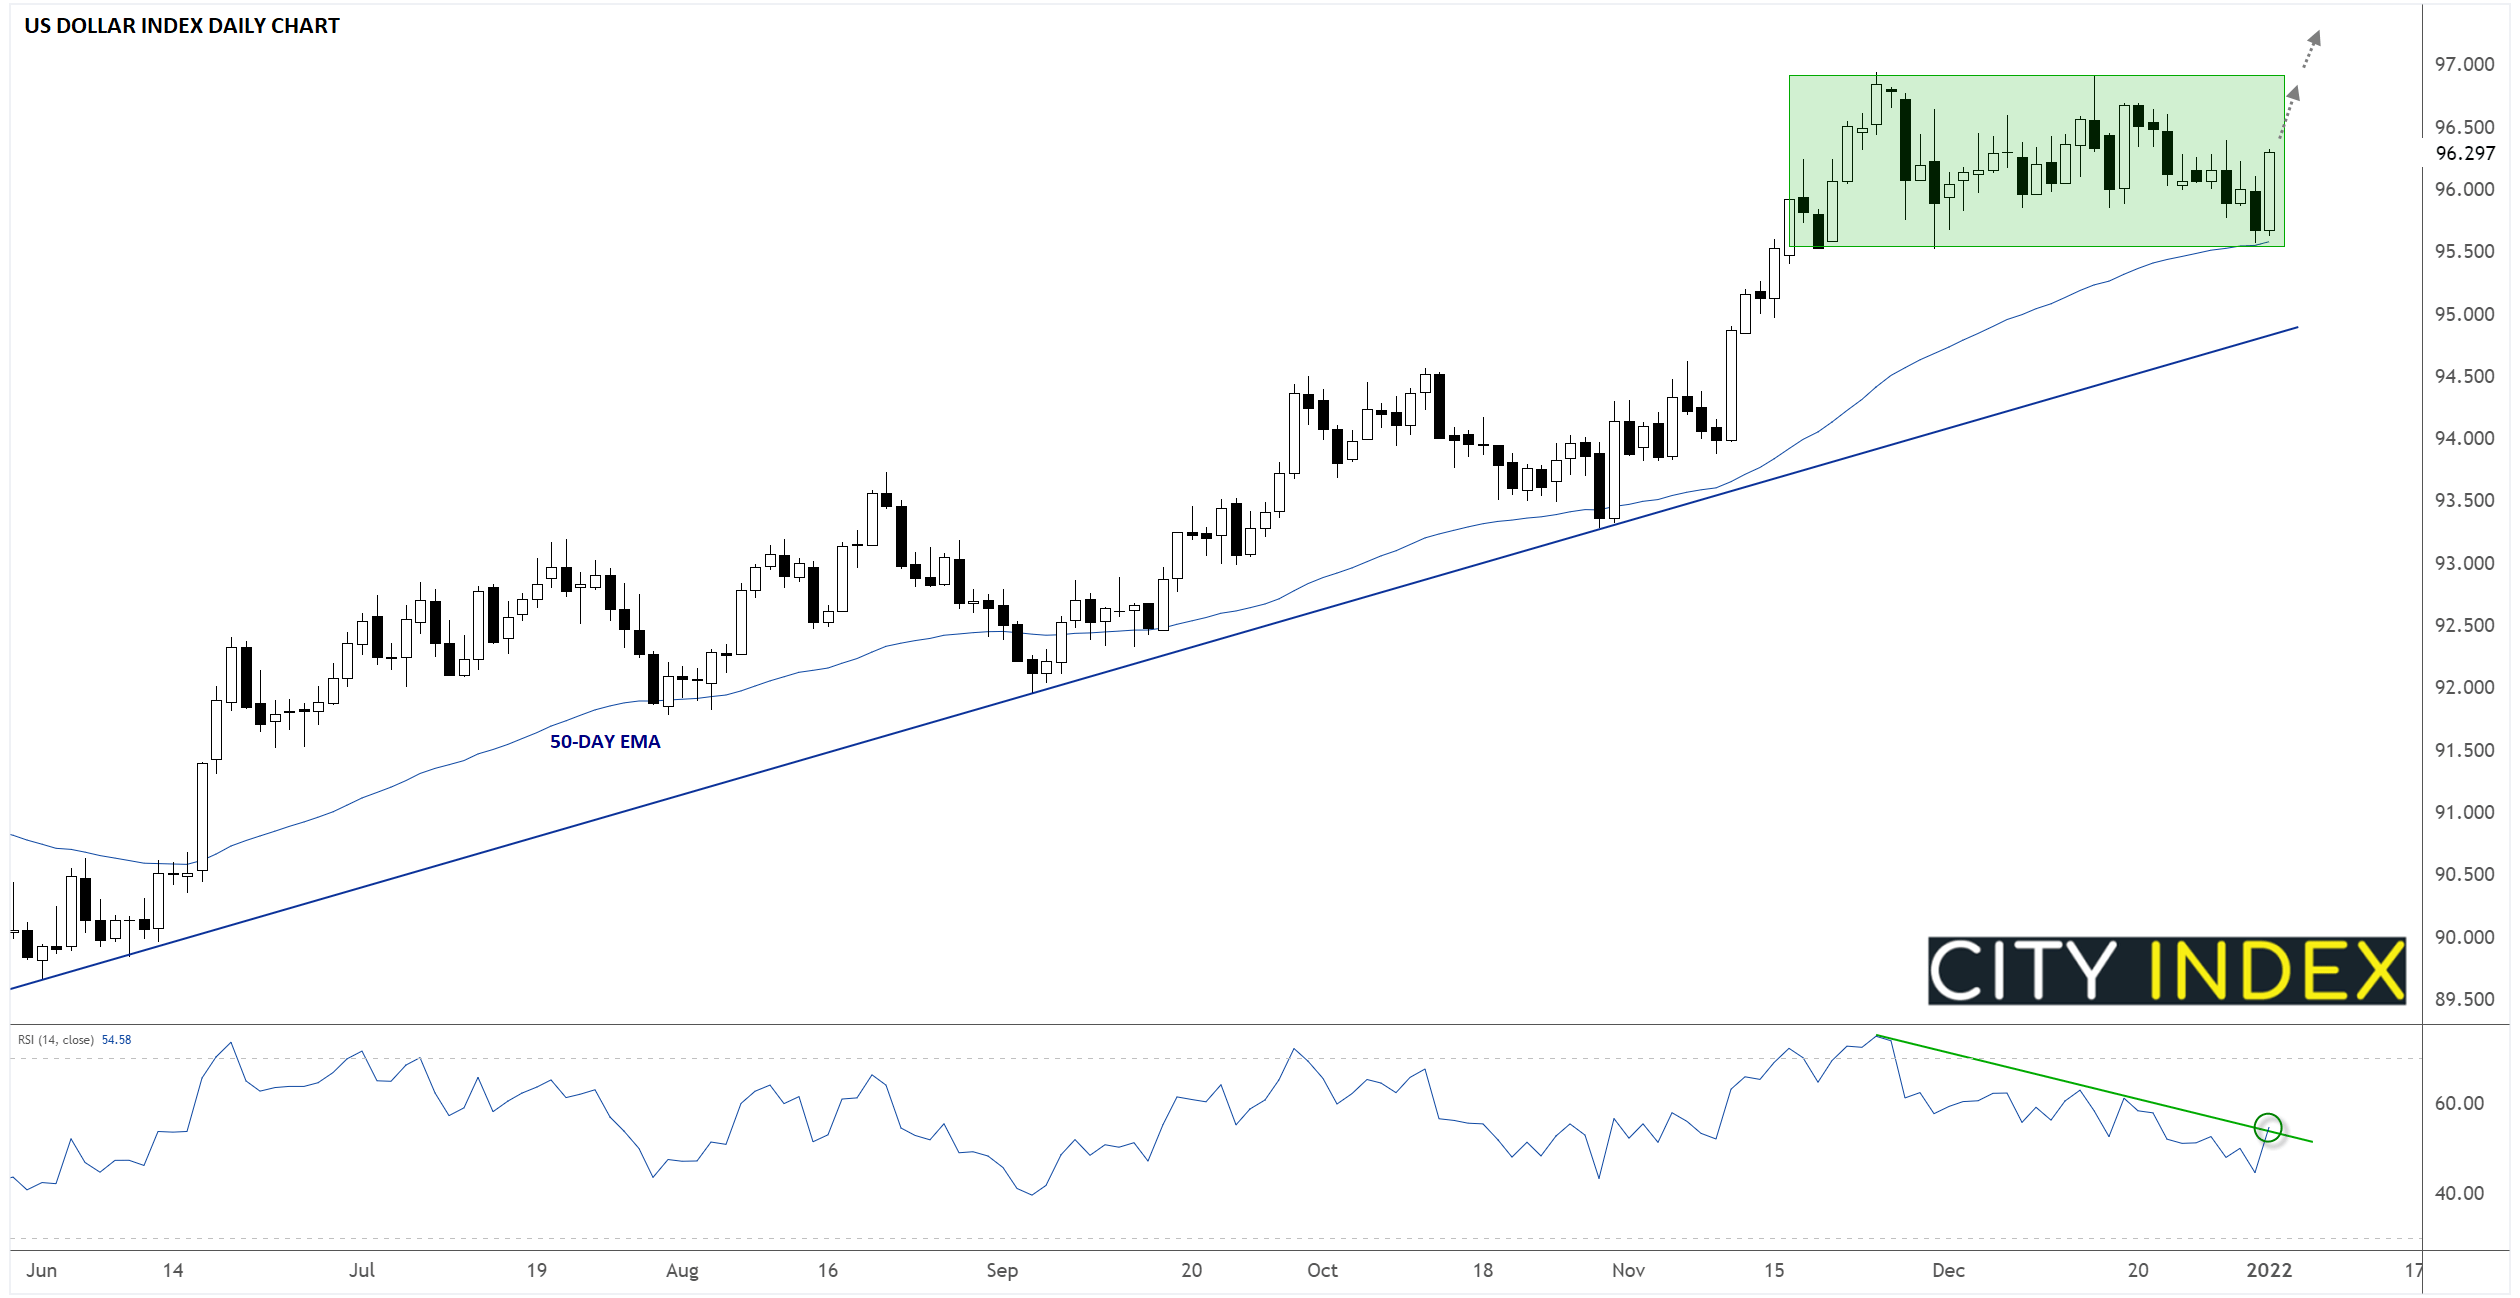
The widely-followed US dollar index has spent the last seven weeks consolidating in a sideways range between roughly 95.50 and 97.00. After drifting down to the bottom of that range in low-liquidity holiday trade last week, buyers have stepped in aggressively to defend support near 95.50 to start this week; the rising 50-day EMA also comes in around that area, creating a confluence of support levels within the longer-term uptrend.
Source: Tradingview, StoneX
Looking ahead, continued rising yields could take the US dollar index back to its 18-month highs near 97.00, with a breakout above that level opening the door for more strength through the first half of the year. Meanwhile, only a breakdown from the recent range and the rising trend line near 95.00 would erase the medium-term bullish outlook for the US dollar index.
As traders trickle back to their desks to start another year, there’s one market move dwarfing all others: The US dollar is trouncing its major rivals. The chart below highlights the move, with the so-called commodity dollars (the Canadian, New Zealand, and Australian dollar) bearing the brunt of the selling (for more on USD/CAD, see my colleague Joe Perry’s Currency Pair of the Week article):
Source: FinViz
So what’s driving the big move in the greenback?
As always, one of the strongest cross-market correlations is between short-term interest rates and currencies. As the chart below shows, the 2-year US Treasury yield is trading up 5bps already today to its highest level since the start of the pandemic 22 months ago:
Source: Tradingview, StoneX
While we haven’t necessarily gotten any new “news” on the outlook for interest rates, it’s clear that investors are more confident than ever that the Federal Reserve will seek to “normalize” monetary policy in 2022. As a reminder, the median Fed voter has indicated that he/she expects 3 interest rate hikes this year, and two-thirds (12/18) of members anticipate at least that many rate increases.
On that note, the economic calendar will be ramping up throughout the next couple of weeks, with both traders and policymakers keen for the latest ISM surveys (Manufacturing tomorrow and Services on Thursday), readings on the labor market (ADP on Wednesday and NFP on Friday), inflation figures (CPI next Wednesday and PPI next Thursday), and retail sales (next Friday) out of the US.
Technical view: US Dollar Index (DXY)
The widely-followed US dollar index has spent the last seven weeks consolidating in a sideways range between roughly 95.50 and 97.00. After drifting down to the bottom of that range in low-liquidity holiday trade last week, buyers have stepped in aggressively to defend support near 95.50 to start this week; the rising 50-day EMA also comes in around that area, creating a confluence of support levels within the longer-term uptrend.
Source: Tradingview, StoneX
Looking ahead, continued rising yields could take the US dollar index back to its 18-month highs near 97.00, with a breakout above that level opening the door for more strength through the first half of the year. Meanwhile, only a breakdown from the recent range and the rising trend line near 95.00 would erase the medium-term bullish outlook for the US dollar index.
How to trade with City Index
You can trade with City Index by following these four easy steps:
- Open an account, or log in if you’re already a customer
• Open an account in the UK
• Open an account in Australia
• Open an account in Singapore
- Search for the company you want to trade in our award-winning platform
- Choose your position and size, and your stop and limit levels
- Place the trade



The complete CFD trading experience
Award-winning platforms, competitive spreads, low commissions and dedicated support.
We live and breathe the markets and are dedicated to helping traders realise their ambitions as we continue to set the industry bar.
Economic calendar
Web Trader platform
Our sophisticated web-based platform is packed with features.
Related articles
EUR/USD, GBP/USD Outlook: RSI Hits 2020 Oversold Levels
EUR/USD, GBP/USD Outlook: The EUR/USD daily RSI has fallen to oversold levels last seen in 2020, raising the risk of a reversal across correlated currency pairs, including the US dollar and GBP/USD.

AUD/USD hammered by US yields and fading RBA hike bets
US yields, dollar strength and fading RBA hike bets have combined to drive AUD/USD to fresh multi-month lows. The macro and technical bias remains bearish, although history suggests parts of the move are now reaching unusually stretched levels.


EUR/USD Forecast: Euro Struggles to Find Support Even After U.S. PCE Data
The euro continues to face a challenging environment in the short term. The currency has struggled to regain ground against a U.S. dollar that remains firmly supported, a dynamic reflected in EUR/USD, which has now recorded three consecutive losing sessions and a decline of roughly 0.6%.

StoneX Europe Ltd may make third party material available on this website which may contain information included but not limited to the conditions of financial markets. The material is for information purposes only and does not contain, and should not be construed as containing, investment advice and/or investment recommendation and/or an investment research and/or an offer of or solicitation for any transactions in financial instruments; any decision to enter into a specific transaction shall be made by the client following an assessment by him/her of their situation.
StoneX Europe Ltd makes no representation or warranty and assumes no liability as to the accuracy or completeness of the information provided, nor any loss arising from any investment based on a recommendation, forecast or other information supplied. You should always seek independent advice as to your suitability to speculate in any related markets and your ability to assume the associated risks, if you are at all unsure. We are not under any obligation to update any such material. Any opinion made may be personal to the author and may not reflect the opinion of StoneX Europe Ltd.