



US housing data continues to soften, S&P500 hits resistance
Both building permits and housing starts declined in June, as high interest rates and inflation continue to weigh on the sector.
Share this:

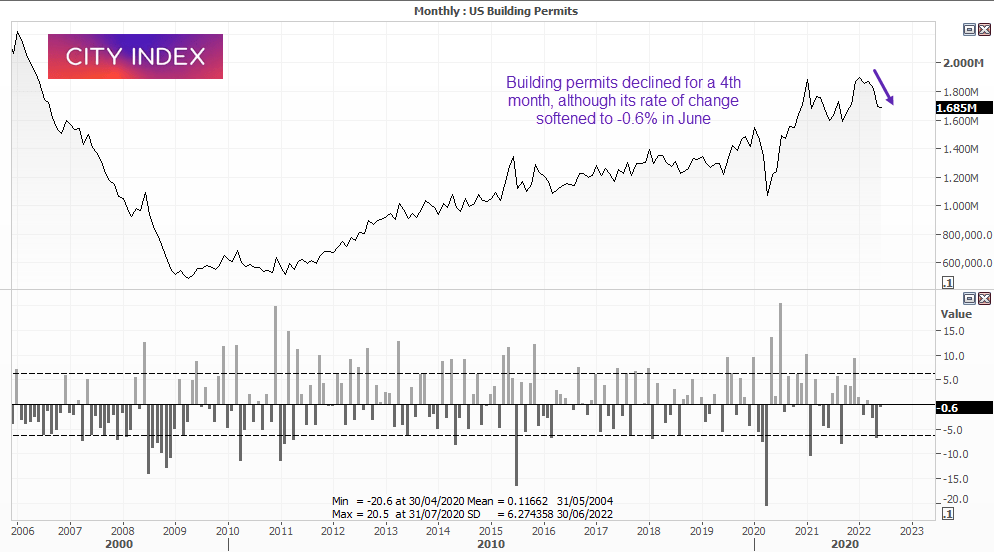
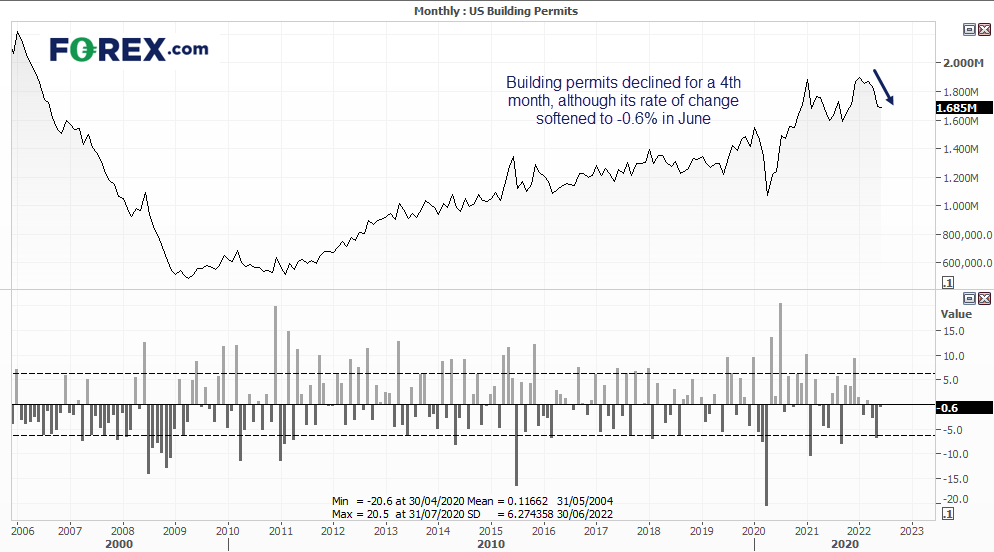
High levels of inflation and rising interest rates continue to weigh on the outlook for the US housing sector, with building permits falling another -0.6% in June. Whilst not as dramatic as the -7% print in May, it’s worth noting that single units fell -8% and 2-4 unit permits fell -5.5%. With consumer confidence and business sentiment in the doldrums, I’m basically waiting for the lagging employment sector to tell us what we already know; the US is headed for a slowdown.
- Building permits declined -0.6% in June (-7.0% prior)
- Single-unit permits were -8% m/m
- 2-4 units fell permits fell -5.5% m/m
- 5+ units rose 13.1%
Builders confidence continues to crumble
On Monday the NAHB/Wells Fargo Housing Market Index (HMI) fell to a 2-year, 2-month low of 55.0. To underscore just how quickly sentiment is nosediving, the index fell -17.9 points in July - its 4th worst month-on-month change on record - and it was already at a 2-year low. This is an important metric to follow because if the experts of the trade have a grim outlook, they may be onto something. Also note that ‘traffic of prospective buyers’ fell to its lowest level since April 2020.
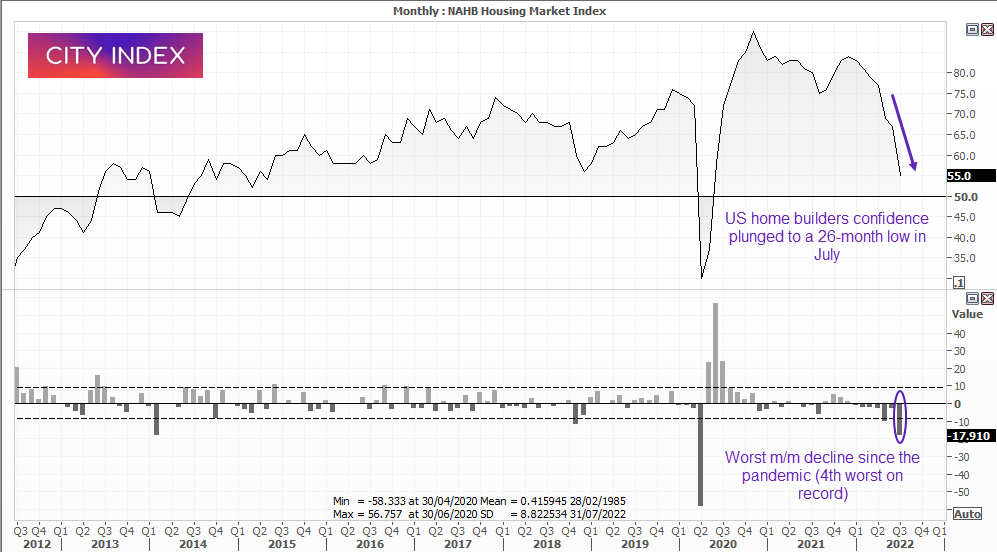
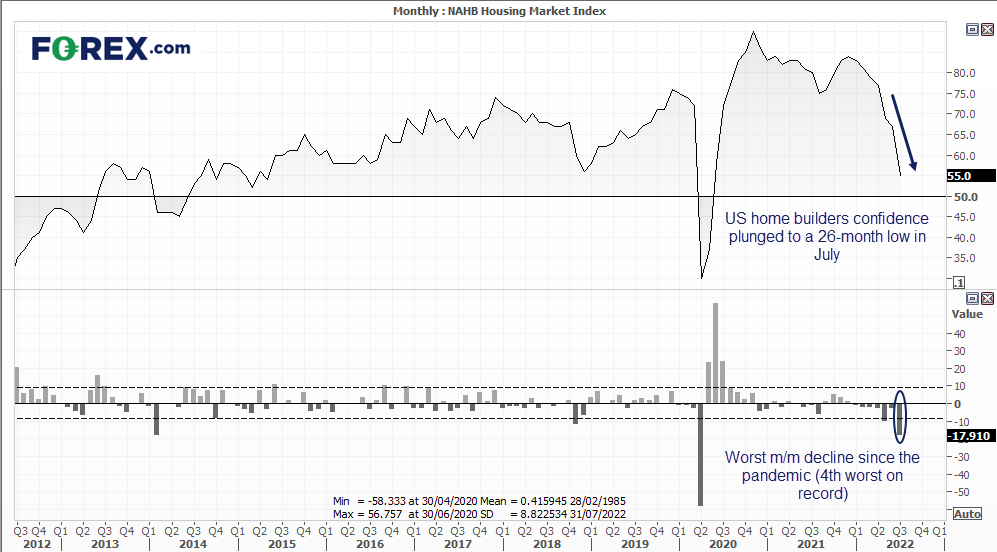
- Builders confidence in newly built single family homes fell for a seventh month, and traffic of prospective buyers fell to 37 – its worst level since April 2020.
- Housing start are going the wrong way of of the gate, having fallen -14.4 million in June during its worst moth since the pandemic.
What does this mean for the Fed?
The latest batch of housing data is unlikely to change the Fed’s decision to hike by 75-bp next week. But it will act as (a rather annoying) reminder that all is not well in the US economy, given the sector is under fire for the rates they are themselves hiking. Ultimately, the longer the housing outlook continues to deteriorate, the greater the odds of a hard landing.
As we head into Thursday, employment data and business sentiment are back in focus. We doubt the Philly Fed index will show any solid turnaround given the dire outlook from businesses in the prior read. But something to keep an eye on is if we do begin to see employment metrics (such as jobless claims on Thursday) nose at a notable pace.
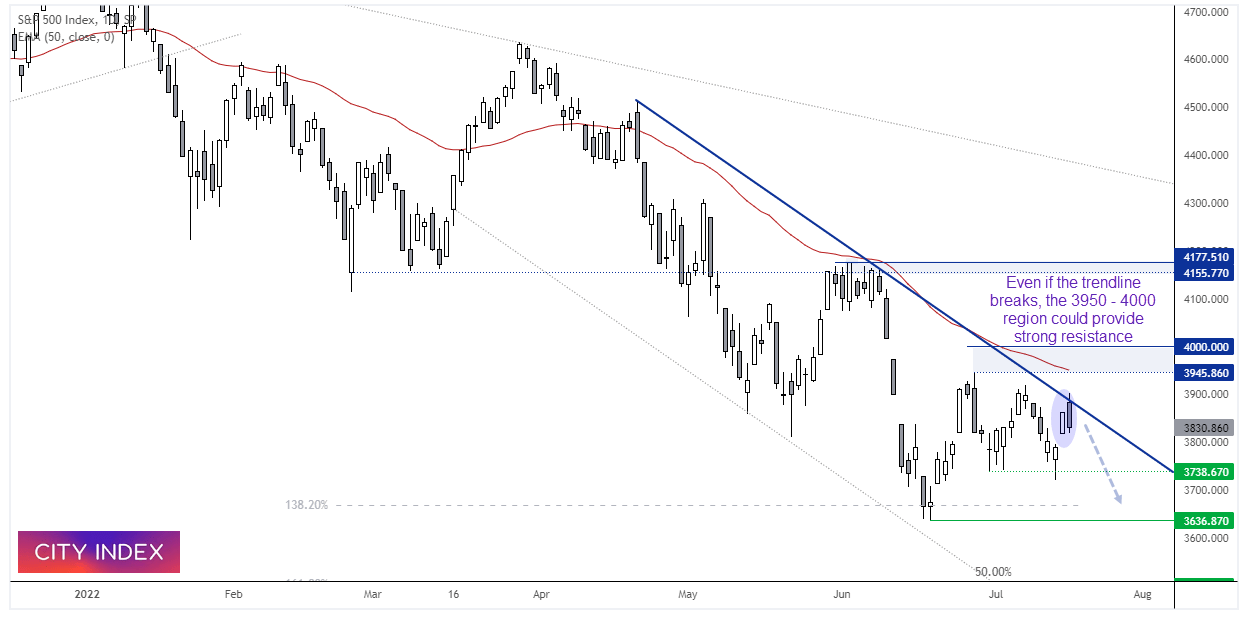
S&P 500 daily chart:
The S&P 500 has been oscillating sideways since late June, although it remains in a downtrend on the daily chart. Yesterday’s bearish candle was part of a 2-bar bearish reversal (dark cloud cover), which could mark a swing high near the upper trendline. Even if prices break higher, I suspect the 3950 – 4000 zone could provide strong resistance. But until we see a break of yesterday’s high the bias is for a move lower towards 3650.

How to trade with City Index
You can easily trade with City Index by using these four easy steps:
- Open an account, or log in if you’re already a customer
• Open an account in the UK
• Open an account in Australia
• Open an account in Singapore
- Search for the company you want to trade in our award-winning platform
- Choose your position and size, and your stop and limit levels
- Place the trade
How to trade with FOREX.com
Follow these easy steps to start trading with FOREX.com today:
- Open a Forex.com account, or log in if you’re already a customer.
- Search for the pair you want to trade in our award-winning platform.
- Choose your position and size, and your stop and limit levels.
- Place the trade.
Latest market news




The complete CFD trading experience
Award-winning platforms, competitive spreads, low commissions and dedicated support.
We live and breathe the markets and are dedicated to helping traders realise their ambitions as we continue to set the industry bar.
Economic calendar
Web Trader platform
Our sophisticated web-based platform is packed with features.
Related articles
S&P 500, Nasdaq, Dow Forecast: Wall Street Split Widens Into Month-End 9 26 2026
Nasdaq strength contrasts with mounting Dow pressure as rising Treasury yields raise the stakes for stocks heading into the monthly close.

EUR/USD weekly outlook: Oil, inflation and NFP in focus
After coming under significant pressure in recent weeks, the EUR/USD came off its lows to finish the week on a positive note on Friday, albeit with only a mild rebound. That was not enough to prevent the exchange rate falling for the third consecutive week, as the US dollar and bond yields rallied across the board.

Gold Q4 2026 outlook: Resilience in the face of rallying dollar and yields
As we headed towards the latter stages of Q3 and into Q4, the Fed had just hiked rates in a hawkish FOMC meeting, while the likes of the ECB and BoJ had also tightened their respective policies. Oil prices remained elevated amid the prolonged US-Iran conflict. Meanwhile, bond yields were breaking out, and the dollar was higher across the board. Yet, remarkably, gold was still holding in the positive territory for the third quarter, even if it had weakened somewhat in September.
StoneX Europe Ltd may make third party material available on this website which may contain information included but not limited to the conditions of financial markets. The material is for information purposes only and does not contain, and should not be construed as containing, investment advice and/or investment recommendation and/or an investment research and/or an offer of or solicitation for any transactions in financial instruments; any decision to enter into a specific transaction shall be made by the client following an assessment by him/her of their situation.
StoneX Europe Ltd makes no representation or warranty and assumes no liability as to the accuracy or completeness of the information provided, nor any loss arising from any investment based on a recommendation, forecast or other information supplied. You should always seek independent advice as to your suitability to speculate in any related markets and your ability to assume the associated risks, if you are at all unsure. We are not under any obligation to update any such material. Any opinion made may be personal to the author and may not reflect the opinion of StoneX Europe Ltd.