



US Indices US Dollar Buy the Dip
What will be the next catalyst to drive market prices?
Share this:

For anyone who was upset about lack of volatility in 2019, they must be ecstatic about 2020! Between the tensions earlier in the Middle East and the Coronavirus, different asset classes have been all over the place. For the last 2 weeks, markets have been in risk-off mode due to the unknowns of the Coronavirus. However, given the stimulus pumped into the market and the unsubstantiated stories that vaccines for the Coronavirus have been developed (or are being developed), traders seem to have forgotten about the tragic virus are back to their normal “buy the dip” mentality we have seen over the course of the last year.
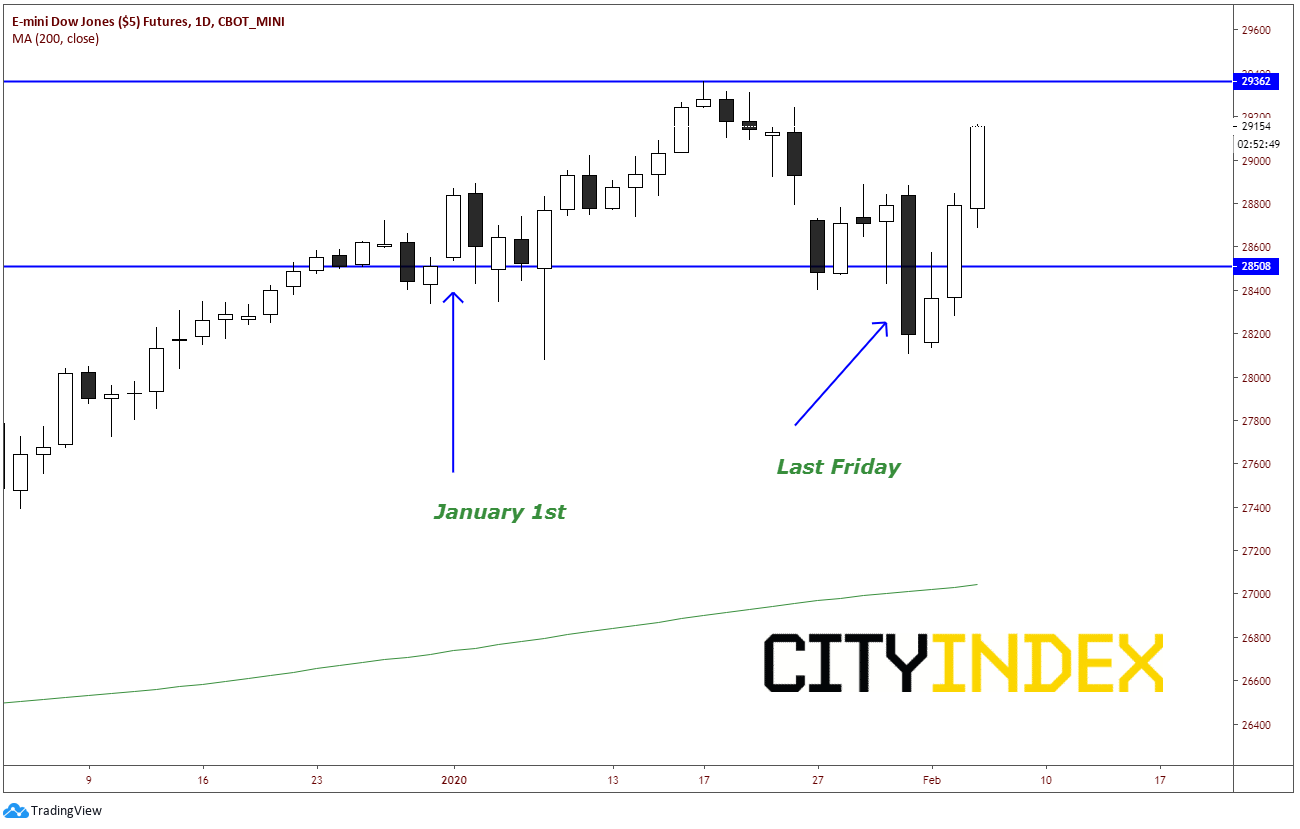
Look at a daily chart of the Dow Jones Futures. Price ended 2019 at 28508 and proceeded to move to all time highs on January 17th at 29362, a move of almost 3% in 2 weeks. As fears of the spread of the Coronavirus spread the Dow Jones Futures traded down to 28105, a move of 4.3% lower and giving up all the 2020 gains. This move low included Friday’s bearish engulfing candle and 595-point selloff. Price moved lower despite stellar earnings from Amazon on Thursday. Clearly fear was in the driver’s seat.
Source: Tradingview, CBOT, City Index
Clearly something has changed over the last 3 days, right? Not really. As mentioned earlier, except for some unsubstantiated stories of new vaccines for the coronavirus, traders just bought the dip. The low on Friday was 28105. Today’s high so far is 29166….a 3-day rally of over +1000 points, or 3.6%!
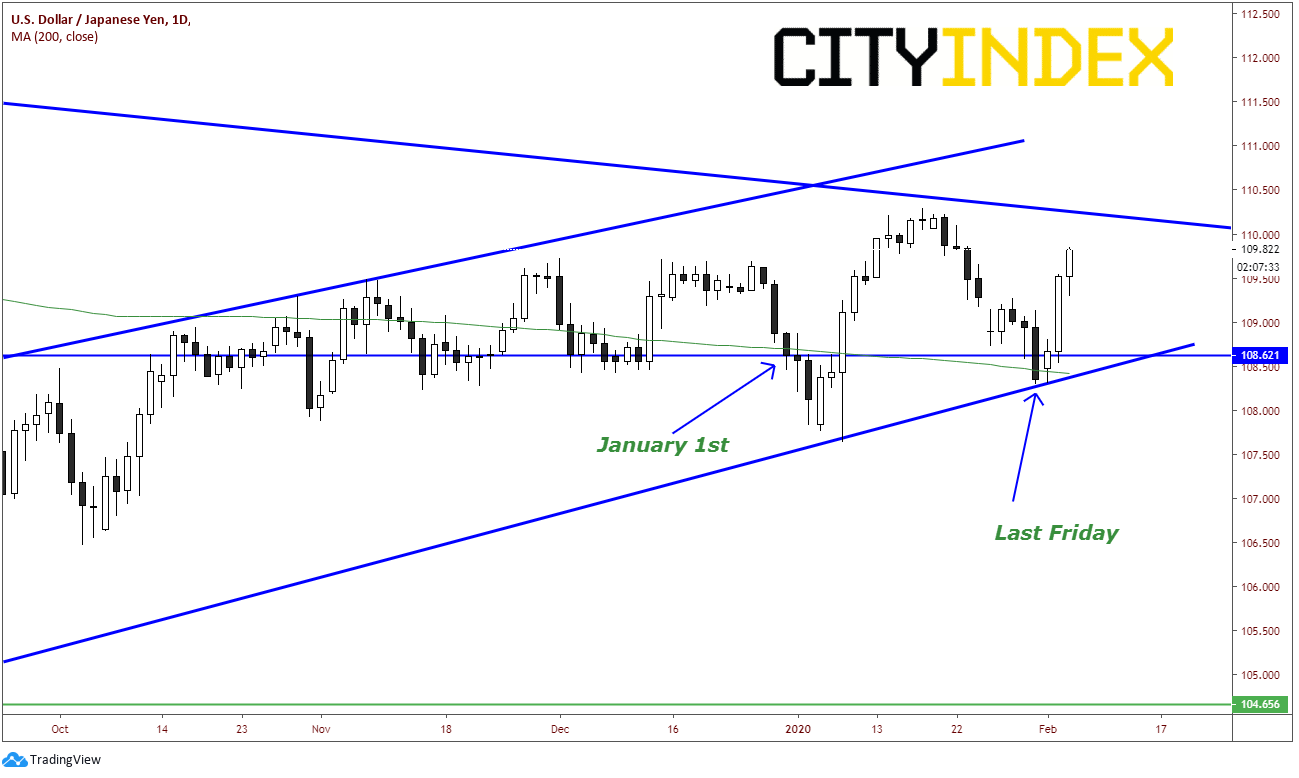
Check out USD/JPY. The USD/JPY is thought to be a risk indicator, just as stocks are. When stocks move lower, USD/JPY tends to move lower as traders buy the safe haven Yen. USD/JPY closed 2019 at 108.62. Just as with stocks, USD/JPY traded to new highs (NOT ALL TIME HIGHS) on January 17th at 110.29, a move of 1.5% in 2 weeks. As stocks sold off, so the USD/JPY. Last Friday, the pair put in a low of 108.31, again giving up all 2020 gains. This move included at 58 pip selloff on Friday alone. After the weekend and over the last 3 days, price has rallied from Friday’s low of 108.31 to today’s high so far of 109.84….a 3 -day rally of +153 pips, or 1.4%.
Source: Tradingview, City Index
That leads us to ask the question: What will be the next catalyst to drive market prices? Friday, we see US Non-Farm payrolls. Today’s ADP data was much better than expectations, however this isn’t typically a market driver. Also, the next Fed meeting isn’t until March 18th, so we will get another round of jobs data before then. Things seem undisturbed in the Middle East, for now. The Coronavirus is seemingly being ignored for now as traders bought the dip. The New Hampshire primary is next week. Perhaps the outcome of the primary may help steer the market. An OPEC cut to drive crude prices higher? Regardless of what the next catalyst, traders have stepped in and bought the dip, which obviously has been working, until it doesn’t!
For anyone who was upset about lack of volatility in 2019, they must be ecstatic about 2020! Between the tensions earlier in the Middle East and the Coronavirus, different asset classes have been all over the place. For the last 2 weeks, markets have been in risk-off mode due to the unknowns of the Coronavirus. However, given the stimulus pumped into the market and the unsubstantiated stories that vaccines for the Coronavirus have been developed (or are being developed), traders seem to have forgotten about the tragic virus are back to their normal “buy the dip” mentality we have seen over the course of the last year.
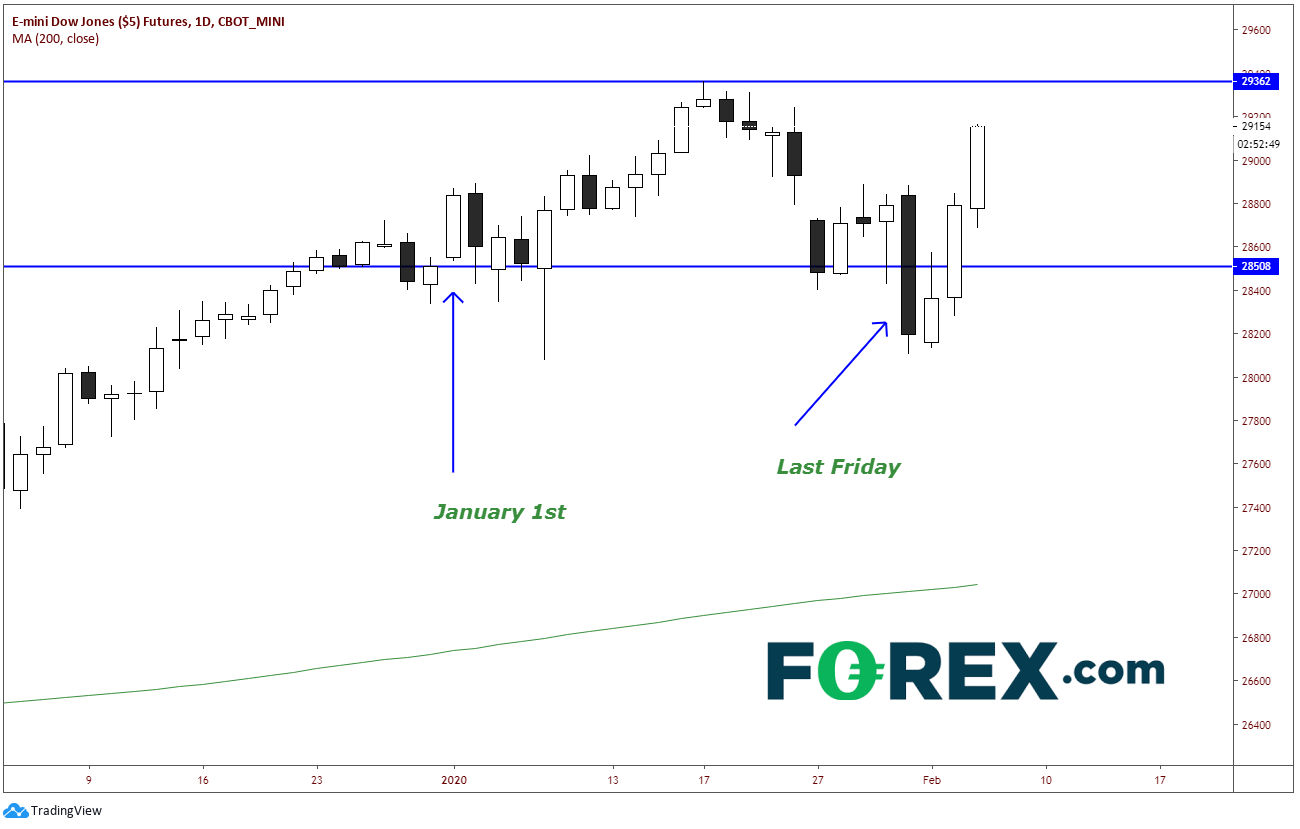
Look at a daily chart of the Dow Jones Futures. Price ended 2019 at 28508 and proceeded to move to all time highs on January 17th at 29362, a move of almost 3% in 2 weeks. As fears of the spread of the Coronavirus spread the Dow Jones Futures traded down to 28105, a move of 4.3% lower and giving up all the 2020 gains. This move low included Friday’s bearish engulfing candle and 595-point selloff. Price moved lower despite stellar earnings from Amazon on Thursday. Clearly fear was in the driver’s seat.
Source: Tradingview, CBOT, FOREX.com
Clearly something has changed over the last 3 days, right? Not really. As mentioned earlier, except for some unsubstantiated stories of new vaccines for the coronavirus, traders just bought the dip. The low on Friday was 28105. Today’s high so far is 29166….a 3-day rally of over +1000 points, or 3.6%!
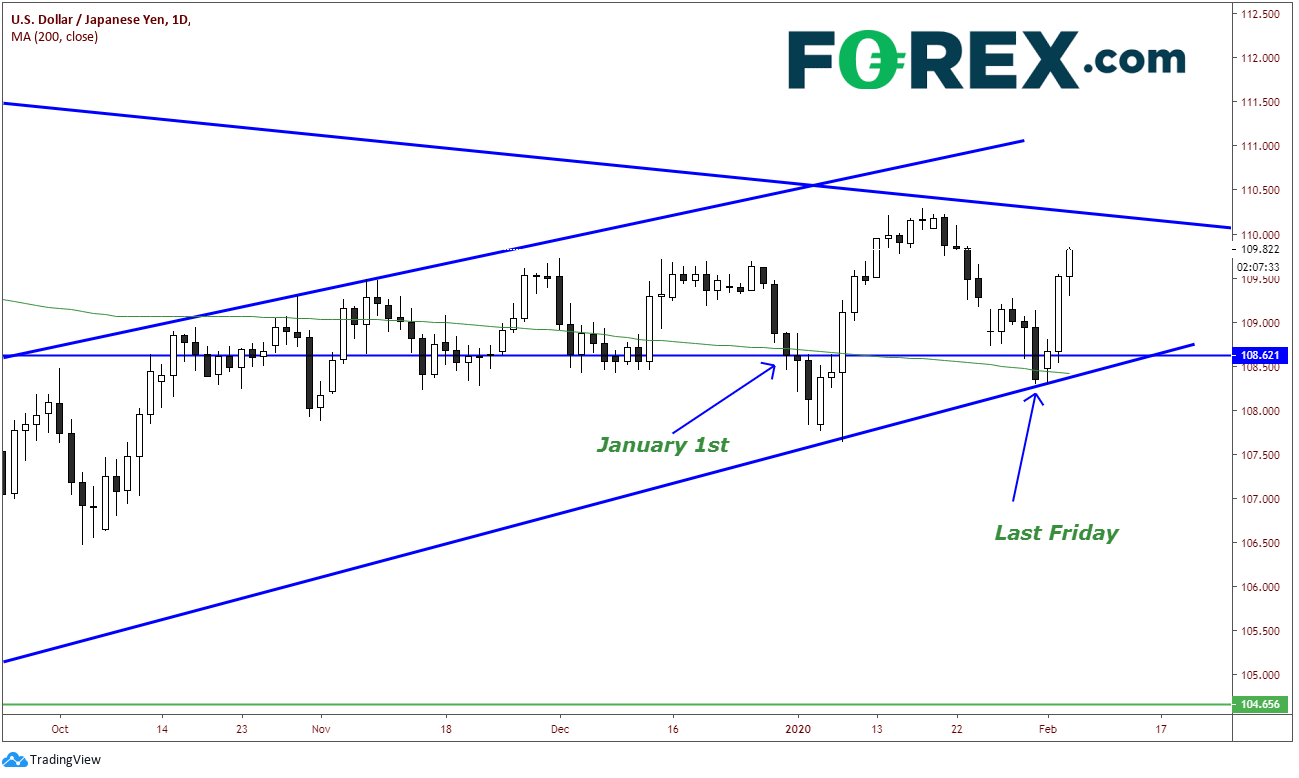
Check out USD/JPY. The USD/JPY is thought to be a risk indicator, just as stocks are. When stocks move lower, USD/JPY tends to move lower as traders buy the safe haven Yen. USD/JPY closed 2019 at 108.62. Just as with stocks, USD/JPY traded to new highs (NOT ALL TIME HIGHS) on January 17th at 110.29, a move of 1.5% in 2 weeks. As stocks sold off, so the USD/JPY. Last Friday, the pair put in a low of 108.31, again giving up all 2020 gains. This move included at 58 pip selloff on Friday alone. After the weekend and over the last 3 days, price has rallied from Friday’s low of 108.31 to today’s high so far of 109.84….a 3 -day rally of +153 pips, or 1.4%.
Source: Tradingview, FOREX.com
That leads us to ask the question: What will be the next catalyst to drive market prices? Friday, we see US Non-Farm payrolls. Today’s ADP data was much better than expectations, however this isn’t typically a market driver. Also, the next Fed meeting isn’t until March 18th, so we will get another round of jobs data before then. Things seem undisturbed in the Middle East, for now. The Coronavirus is seemingly being ignored for now as traders bought the dip. The New Hampshire primary is next week. Perhaps the outcome of the primary may help steer the market. An OPEC cut to drive crude prices higher? Regardless of what the next catalyst, traders have stepped in and bought the dip, which obviously has been working, until it doesn’t!
Latest market news




The complete CFD trading experience
Award-winning platforms, competitive spreads, low commissions and dedicated support.
We live and breathe the markets and are dedicated to helping traders realise their ambitions as we continue to set the industry bar.
Economic calendar
Web Trader platform
Our sophisticated web-based platform is packed with features.
Related articles
EUR/USD weekly outlook: Oil, inflation and NFP in focus
After coming under significant pressure in recent weeks, the EUR/USD came off its lows to finish the week on a positive note on Friday, albeit with only a mild rebound. That was not enough to prevent the exchange rate falling for the third consecutive week, as the US dollar and bond yields rallied across the board.


EUR/USD Q4 2026 Outlook: Euro at a Crossroads as Fed, ECB Tighten 9 25 2026
EUR/USD enters Q4 at a pivotal inflection point as competing Fed-ECB policy paths and persistent inflation risks collide with major technical support.


S&P 500 Forecast: SPX rises as oil prices fall, but treasuries remain at multi-decade highs
U.S. stocks are rising on Friday after a volatile week that saw a surge in Treasury yields ripple through financial markets.
StoneX Europe Ltd may make third party material available on this website which may contain information included but not limited to the conditions of financial markets. The material is for information purposes only and does not contain, and should not be construed as containing, investment advice and/or investment recommendation and/or an investment research and/or an offer of or solicitation for any transactions in financial instruments; any decision to enter into a specific transaction shall be made by the client following an assessment by him/her of their situation.
StoneX Europe Ltd makes no representation or warranty and assumes no liability as to the accuracy or completeness of the information provided, nor any loss arising from any investment based on a recommendation, forecast or other information supplied. You should always seek independent advice as to your suitability to speculate in any related markets and your ability to assume the associated risks, if you are at all unsure. We are not under any obligation to update any such material. Any opinion made may be personal to the author and may not reflect the opinion of StoneX Europe Ltd.