



USD/JPY: Has Buy the Dip Turned into Sell the Rip?
Both the US and Japan have rate decisions this week and both are expected to hike rates. But perhaps the bigger question is one of positioning and whether USD/JPY longs will pare back exposure.
Share this:

USD/JPY Talking Points:
- USD/JPY has carried a bullish bias for much of the past five years and while the fundamental tilt remains to the long side, the question now is whether a larger retracement is ahead.
- This week brings rate decisions from both Japan and the US, and Scott Bessent has previously warned that he knows what the Bank of Japan will do. This week we’ll hear more on that matter.
This content was created by an affiliate of FOREX.com and represents the views and opinions of the author/speakers, not the views and opinions of Forex.com, StoneX Group Inc., or its subsidiaries. The content has not been independently reviewed by FOREX.com.
USD/JPY was my third top chart for this week and if we do see a continued sell-off in the pair, there could be consequences elsewhere. We caught a glimpse of this back in July of 2024, when a cascading USD/JPY with a carry trade unwinding hit many levered trades, such as tech stocks. So even though odds of a US rate cut were going higher, stocks cratered for a few weeks, and the big reason why was leverage produced by the carry trade was coming out of the market.
To be sure, stocks selling off isn’t a necessity in a bearish USD/JPY scenario, it’s just a possibility as there’s some degree of linkage between the two markets. With low Japanese rates investors flocked to borrow money cheaply in the Japanese Yen. That cheap money then seeped into several markets, tech stocks included; so if we do see the tide receding and Japanese rates moving higher, then, logically, many of the trades funded by that cheap money could similarly retrace.
At this point, however, the fear appears to be somewhat contained, as the delta between inflation data of the two economies remains pretty wide. But, if we do hear of any surprises from the Japanese side, and given the surge in Japanese government bond rates there’s certainly motivation for it, then we could see a whole host of new scenarios to entertain.

First thing first – the trend: From the weekly chart below we can see a clear bullish lean over the past five-plus years. But, there’s also been several retracements, each of which have been aggressive. This takes on the ‘up the stairs, down the elevator’ logic that is commonplace with such scenarios. And perhaps more importantly, over the past month-plus, it appears as though there’s been a clear change-of-pace.
USD/JPY Weekly Chart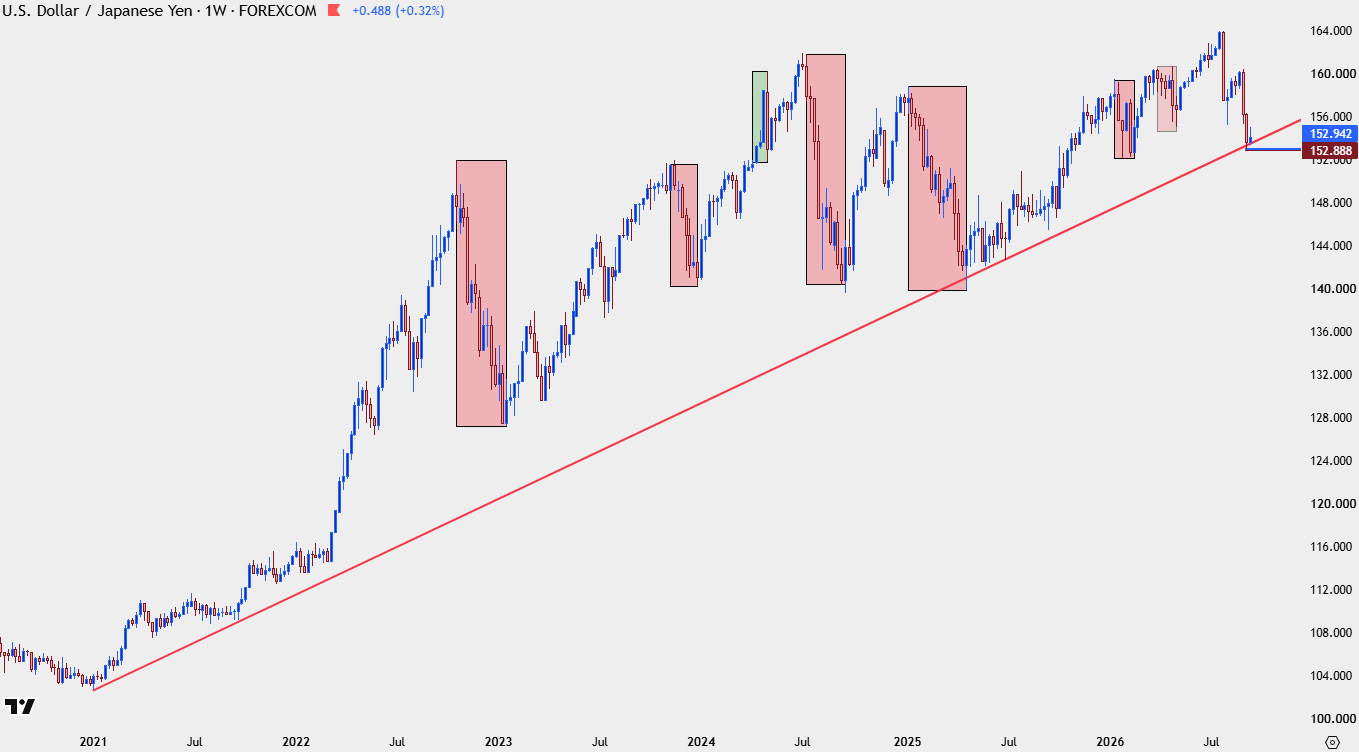
Chart prepared by James Stanley; data derived from Tradingview
USD/JPY: Don’t Fight the Fed
The old saying is don’t fight the Fed but that’s evolved here, as it’s more of the US Treasury Department and the Bank of Japan that’s of concern. That’s also reason for this recent change in the chart, as the dual intervention in late-July has shifted matters, even with the fundamental bias remaining tilted to the long side of the pair.
Interestingly, it’s the Fed that’s expected to push that divergence even more this week when they walk into Wednesday’s rate meeting. This is followed by the BoJ later in the week, and they too are expected to hike rates. But, perhaps more important is how sellers respond, and such as we’ve seen this morning with the 155.00 test, they’ve used that rally to so far sell the pair.
USD/JPY Daily Chart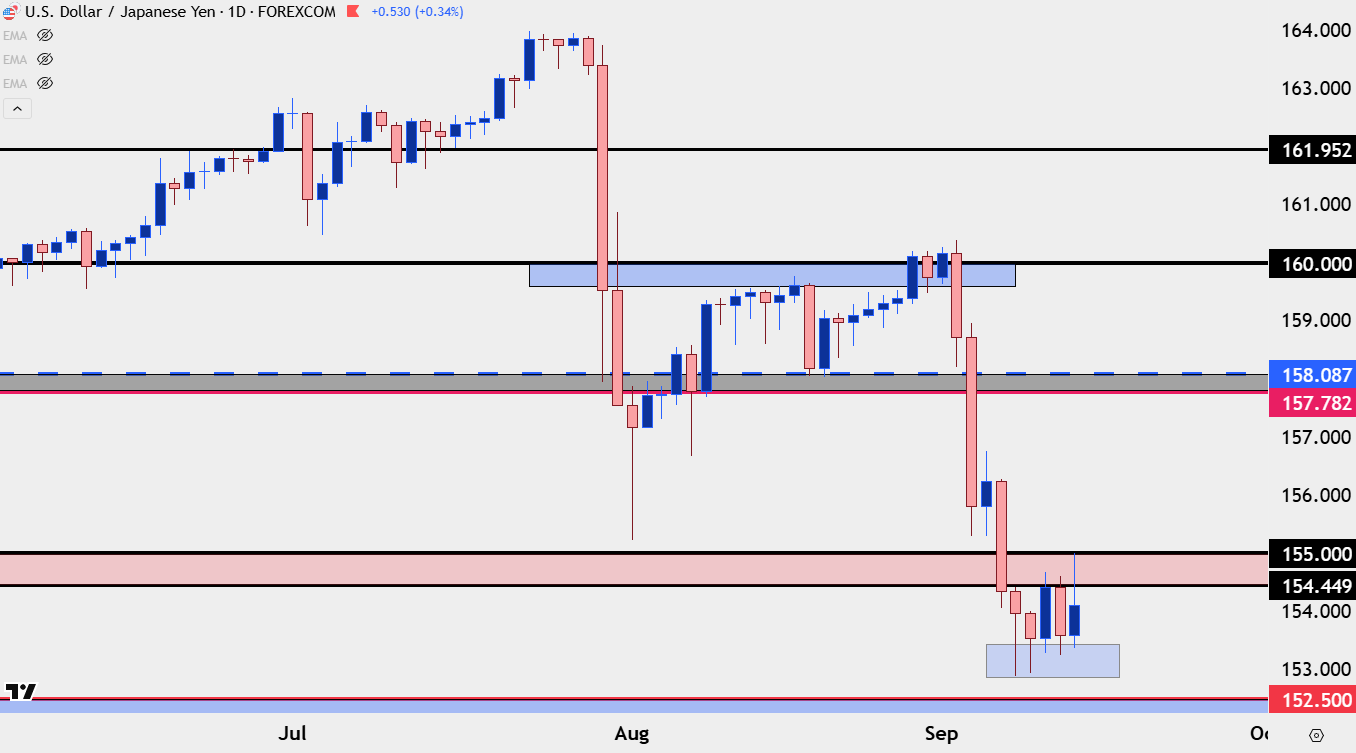
Chart prepared by James Stanley; data derived from Tradingview
USD/JPY Shorter-Terms
From shorter-terms, there has remained a dip-buying mentality as buyers came into support 153.00. This has led to a degree of derision on social media, pointing to Treasury Secretary Scott Bessent’s ‘you can bet against me if you want’ comments and alluding to some degree of failure.
Traders should be careful with that, as Bessent has more tools at his disposal to accomplish his aims. So, perhaps there could be a bounce to work with on support, but perhaps more enticing is the prospect of fading bullish breakouts – in effort of aligning with US and Japanese policymakers in the direction that they want the pair to go.
So far we’ve seen 155.00 defended. But from the four-hour chart below there’s a case to be made for support around prior resistance, from around the 153.73 area. The challenge on the long side is the risk of a comment or some form of intervention, so while there could still be justification for support the larger question is for how long to work with the position.
For shorts, however, perhaps the more attractive path forward – in the event that buyers do protect the higher-low, is to see if there’s some degree of exhaustion after a 155.00 test, with 155.44 looming just above the big figure, or perhaps 156.68 which was support turned resistance, above that.
USD/JPY Four-Hour Chart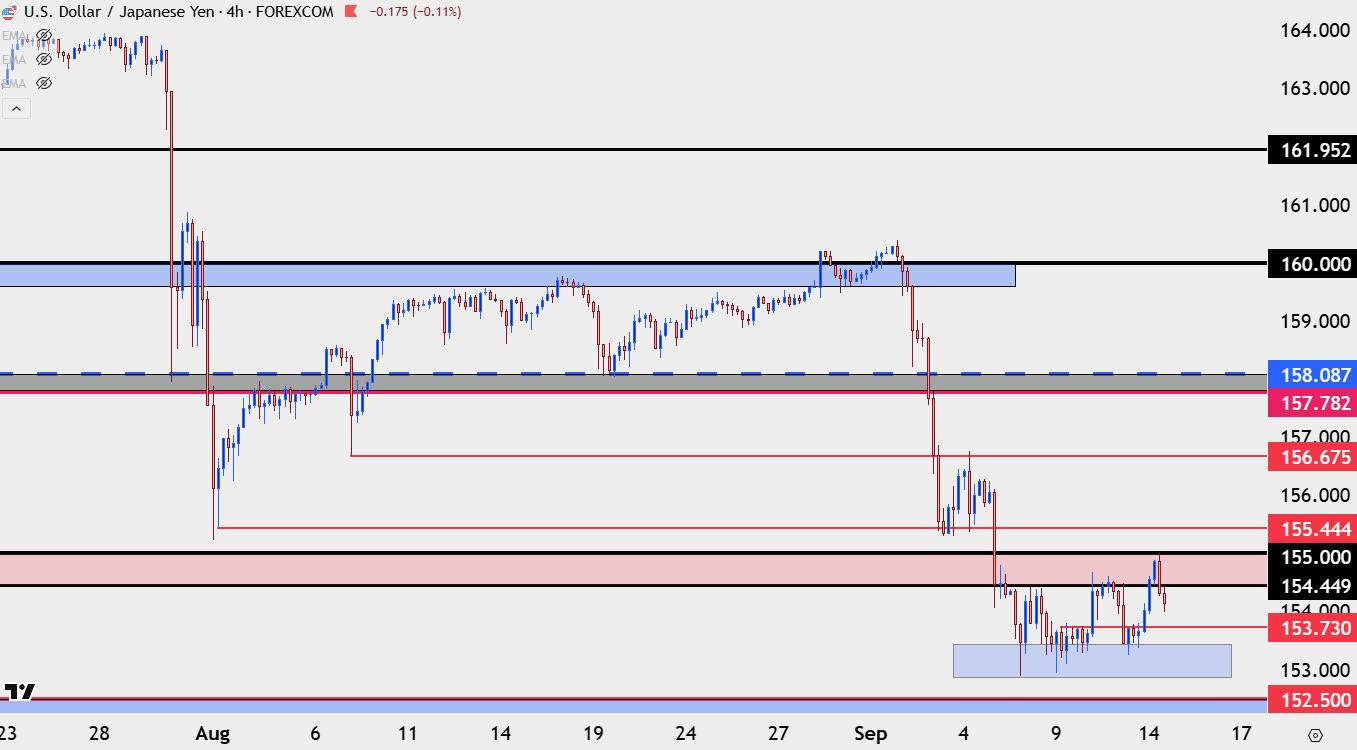
Chart prepared by James Stanley; data derived from Tradingview
--- written by James Stanley, Senior Market Analyst, Global Macro
Related tags:
Latest market news




The complete CFD trading experience
Award-winning platforms, competitive spreads, low commissions and dedicated support.
We live and breathe the markets and are dedicated to helping traders realise their ambitions as we continue to set the industry bar.
Economic calendar
Web Trader platform
Our sophisticated web-based platform is packed with features.
Related articles
Gold Price Forecast: XAU/USD Avoids Breakdown as Yields Surged but Can it Continue?
Surging Treasury yields sent a jolt across markets last week but, so far, gold prices have held above the FOMC low. The big question now is whether that can continue and, if not, will bulls show up at $4100 or $4k like they did in June and July?

Equity Indices Q4, 2026 Outlook: Cracks Begin to Show
There's still an open door for a melt-up in the S&P 500 and Nasdaq but the Dow and Russell 2000 are looking more vulnerable, and until calm hits the Treasuries market there's a higher probability for volatility. The big question is whether that's a next quarter theme or not.

USD/JPY Q4 2026 Outlook: Hawkish Fed Pricing Clashes With Intervention Risk
The year-end tug-of-war is clear: hawkish Fed pricing supports USD/JPY, while intervention risk limits the upside.

StoneX Europe Ltd may make third party material available on this website which may contain information included but not limited to the conditions of financial markets. The material is for information purposes only and does not contain, and should not be construed as containing, investment advice and/or investment recommendation and/or an investment research and/or an offer of or solicitation for any transactions in financial instruments; any decision to enter into a specific transaction shall be made by the client following an assessment by him/her of their situation.
StoneX Europe Ltd makes no representation or warranty and assumes no liability as to the accuracy or completeness of the information provided, nor any loss arising from any investment based on a recommendation, forecast or other information supplied. You should always seek independent advice as to your suitability to speculate in any related markets and your ability to assume the associated risks, if you are at all unsure. We are not under any obligation to update any such material. Any opinion made may be personal to the author and may not reflect the opinion of StoneX Europe Ltd.