





USD/JPY key reversal day forms – but is it significant?
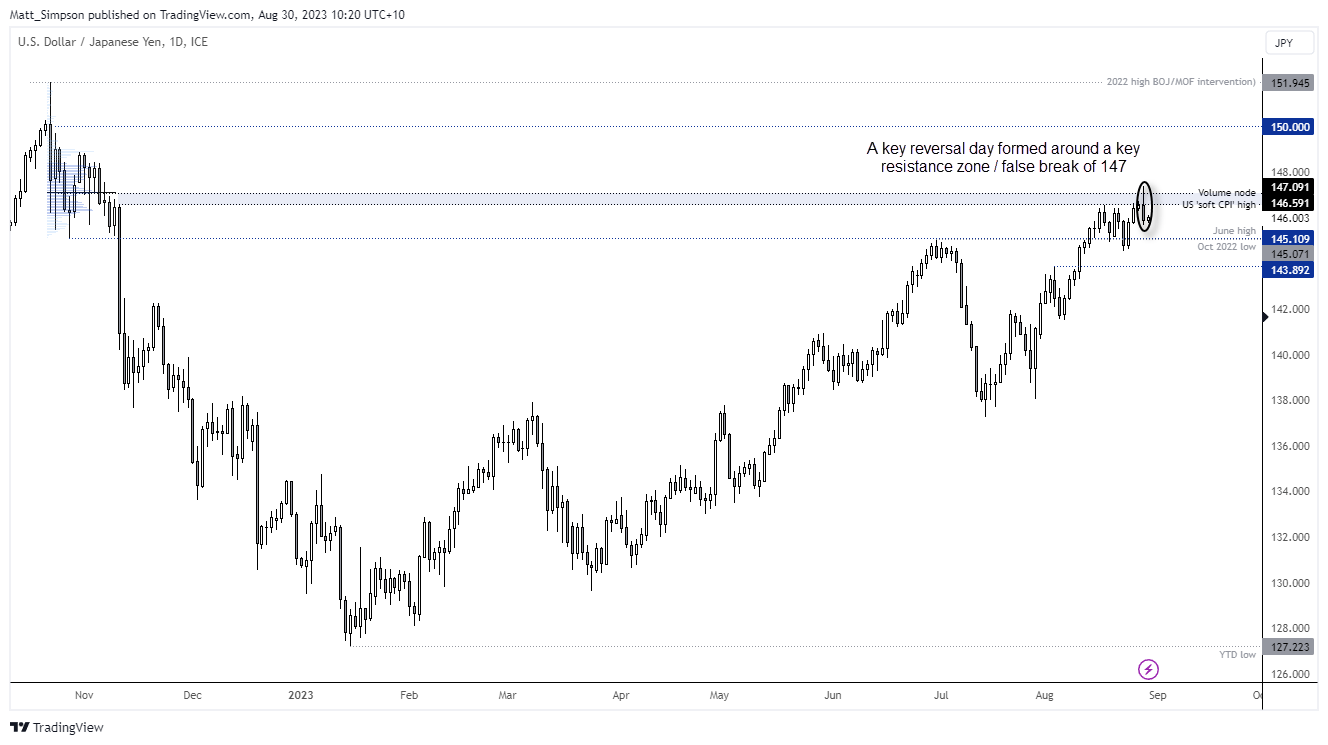
USD/JPY reached a 9-month high on Tuesday before promptly falling and forming an ominous bearish reversal pattern called a key reversal. It remains up in the air as to whether it is significant.
Share this:

USD/JPY daily chart
We can see on the daily chart that a bearish engulfing / outside candle formed on USD/JPY, a pattern which textbooks will show that it is a classic reversal pattern. It’s interesting to note that it formed with a false break of 147 – an area I warned about yesterday – as it includes the US ‘soft-CPI’ high and volume node from the 2022 highs.
Such patterns are key resistance area can generate a lot of excitement about a potential reversal, but I continue suspect caution is warranted around these highs regardless of whether one is bullish or bearish on the pair.
Lower US yields and USD explain the move (in response to second-tier data)
For starters, the reversal is largely a US dollar move, and one that was triggered by the US JOLTS job openings report. While the Fed does monitor it, it is generally considered a second-tier data and the Fed follows many other metrics to assess the employment market (such as NFP on Friday). That means we could just as easily see USD/JPY rally and recoup some of yesterday's losses if subsequent US data is hot, as we could see it fall further if incoming data backs up the job opening report.
But we also need to factor in the yen. While USD/JPY formed a bearish outside day, the yen remained weak against the six other forex major pairs, with an equally-weighted yen basket remaining near its cycle highs. Sure, this also keeps the pressure on the BOJ/MOF to verbally intervene if the yen loses its value too quickly against its trade partners, but at this stage we cannot yet tell if USD/JPY is the "canary in the coalmine" or the lone sheep that is about to get slaughtered.
For this reason, and as much as I love a good reversal pattern, I would prefer to stick to intraday timeframes and trade around key levels, and not look for the larger macro move. There are risks that the BOJ/MOF may verbally intervene to push USD/JPY, but there are also risks that US data could push yields and USD/JPY back higher.
USD/JPY technical analysis (1-hour chart):
USD/JPY has made the obligatory retracement against the prior day’s move, just after the Tokyo open. And given the liquidity gaps it likely left on its way down yesterday, I will not underestimate its potential to retrace higher before the next real move occurs. The 146.26 lows / daily pivot point is a potential area of interest for bears to fade into for a move towards the daily S1 / October 2022 low / June high.
Given the significance of this level, it also makes an area of interest for bulls to consider longs – especially if US data comes in strong as the week develops.
-- Written by Matt Simpson
Follow Matt on Twitter @cLeverEdge
How to trade with City Index
You can trade with City Index by following these four easy steps:
- Open an account, or log in if you’re already a customer
• Open an account in the UK
• Open an account in Australia
• Open an account in Singapore
- Search for the market you want to trade in our award-winning platform
- Choose your position and size, and your stop and limit levels
- Place the trade
Related tags:
Latest market news




The complete CFD trading experience
Award-winning platforms, competitive spreads, low commissions and dedicated support.
We live and breathe the markets and are dedicated to helping traders realise their ambitions as we continue to set the industry bar.
Economic calendar
Web Trader platform
Our sophisticated web-based platform is packed with features.
Related articles
EUR/USD weekly outlook: Oil, inflation and NFP in focus
After coming under significant pressure in recent weeks, the EUR/USD came off its lows to finish the week on a positive note on Friday, albeit with only a mild rebound. That was not enough to prevent the exchange rate falling for the third consecutive week, as the US dollar and bond yields rallied across the board.

Gold Q4 2026 outlook: Resilience in the face of rallying dollar and yields
As we headed towards the latter stages of Q3 and into Q4, the Fed had just hiked rates in a hawkish FOMC meeting, while the likes of the ECB and BoJ had also tightened their respective policies. Oil prices remained elevated amid the prolonged US-Iran conflict. Meanwhile, bond yields were breaking out, and the dollar was higher across the board. Yet, remarkably, gold was still holding in the positive territory for the third quarter, even if it had weakened somewhat in September.

EUR/USD Q4 2026 Outlook: Euro at a Crossroads as Fed, ECB Tighten 9 25 2026
EUR/USD enters Q4 at a pivotal inflection point as competing Fed-ECB policy paths and persistent inflation risks collide with major technical support.

StoneX Europe Ltd may make third party material available on this website which may contain information included but not limited to the conditions of financial markets. The material is for information purposes only and does not contain, and should not be construed as containing, investment advice and/or investment recommendation and/or an investment research and/or an offer of or solicitation for any transactions in financial instruments; any decision to enter into a specific transaction shall be made by the client following an assessment by him/her of their situation.
StoneX Europe Ltd makes no representation or warranty and assumes no liability as to the accuracy or completeness of the information provided, nor any loss arising from any investment based on a recommendation, forecast or other information supplied. You should always seek independent advice as to your suitability to speculate in any related markets and your ability to assume the associated risks, if you are at all unsure. We are not under any obligation to update any such material. Any opinion made may be personal to the author and may not reflect the opinion of StoneX Europe Ltd.