





USDCAD to New Highs as Oil Tanks
If crude does continue to move lower, one can expect USD/CAD to continue moving higher.
Share this:

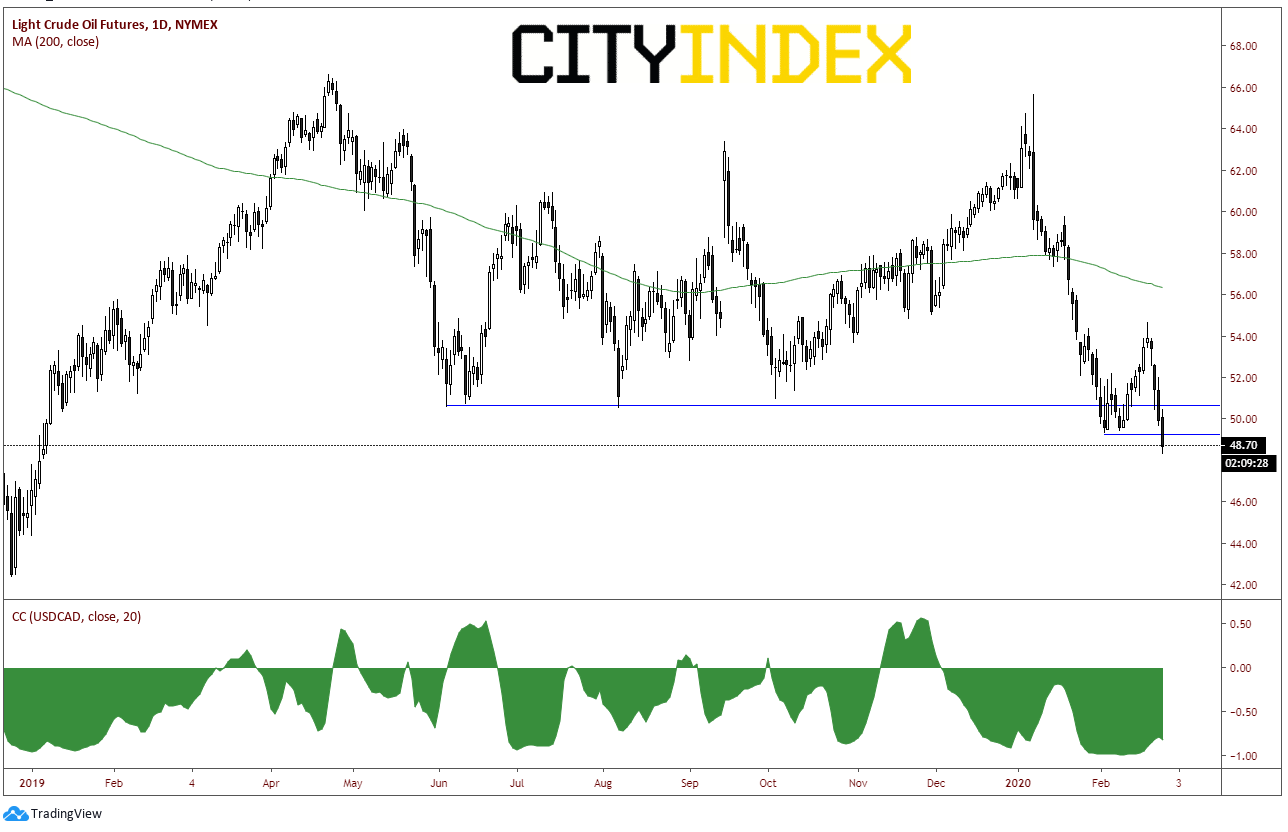
USD/CAD put in a new 4 ½ month high today near 1.3333 as Crude Oil is trading at its lowest levels in 13 months, with front month crude futures down another 2.5% on the day. Canada is an oil lead exporting country. As the coronavirus continues to spread throughout the world (today, 83 cases being monitored in Nassau County near New York City), the expectations continue to be that the demand for crude oil will be lower. As expectations for demand fall, so does the price of oil. As such, when the price of crude oil falls, so does that value of the Canadian Dollar. The the daily chart of Crude Oil below, the current correlation coefficient is -.81 (which is actually off the lows from last week of near -1.00!)
Source: Tradingview, NYMEX, City Index
Next week, on March 4th, the Bank of Canada will meet again to discuss interest rates. The BOC has left rates unchanged since 2018 at 1.75% At their last meeting, they took a slightly more dovish stance and said that they would closely monitor the economy and the recent global growth slowdown. That meeting was on January 22nd. Although current expectations are for the BOC to remain on hold once again, a lot has changed since their last meeting when crude oil was at 56.74. Phase One of the US-China Trade Deal was just signed a week earlier, and there wasn’t any talk of the coronavirus. Look how much can change in 6 weeks…they will have much to discuss!
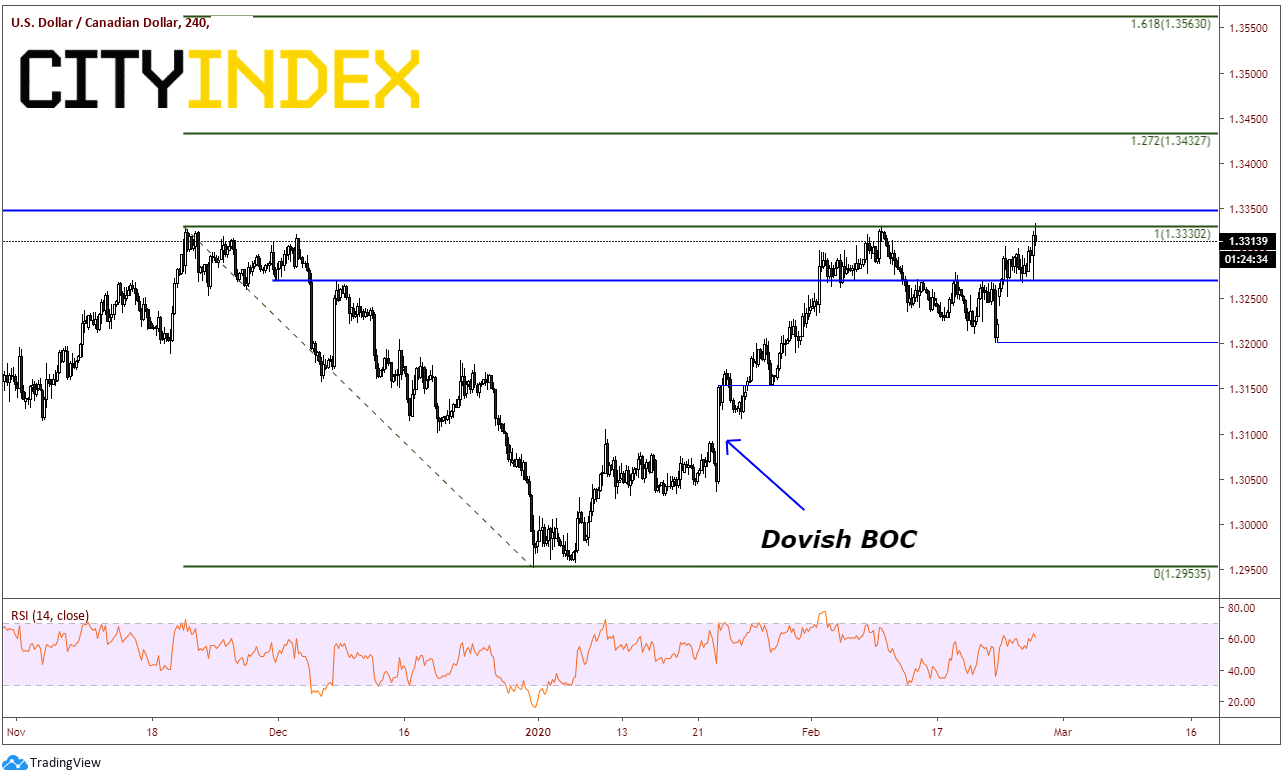
USD/CAD has been in a symmetrical triangle since early 2016. At the end of 2019, price broke below the bottom, upward sloping trendline of the triangle (which dates back to 2012) and tested 1.3000. Price briefly traded into the 1.29 handle and bounced back into the apex of the triangle.
Source: Tradingview, City Index
Notice on the 240-minute chart what happened at the last BOC meeting, when they turned from neutral to dovish. If they are even more dovish, price may continue higher! If price can close above current levels, there is horizonal resistance above at 1.3357. After that is the 127.2% Fibonacci extension from the highs on November 20th, 2019 to the lows on December 31st, at 1.3432. Above that is the 161.8% Fibonacci extension from the same time period which comes in at 1.3560. This also coincides with a previous peak in May of last year (on daily timeframe). Fist support is at todays lows of 1.3271. Below that, Friday’s lows near 1.3200 and then the highs on the move after the BOC meeting on January 22nd near 1.3150.
Source: Tradingview, City Index
If crude does continue to move lower, one can expect USD/CAD to continue moving higher. In addition, if the BOC continues to be dovish at its interest rate decision meeting next week, USD/CAD also may continue higher. However, if crude starts to bounce (perhaps a relief bounce in the short term), USD/CAD could pull back, which may give traders another chance to buy before the BOC meeting.
USD/CAD put in a new 4 ½ month high today near 1.3333 as Crude Oil is trading at its lowest levels in 13 months, with front month crude futures down another 2.5% on the day. Canada is an oil lead exporting country. As the coronavirus continues to spread throughout the world (today, 83 cases being monitored in Nassau County near New York City), the expectations continue to be that the demand for crude oil will be lower. As expectations for demand fall, so does the price of oil. As such, when the price of crude oil falls, so does that value of the Canadian Dollar. The the daily chart of Crude Oil below, the current correlation coefficient is -.81 (which is actually off the lows from last week of near -1.00!)
Source: Tradingview, NYMEX, FOREX.com
Next week, on March 4th, the Bank of Canada will meet again to discuss interest rates. The BOC has left rates unchanged since 2018 at 1.75% At their last meeting, they took a slightly more dovish stance and said that they would closely monitor the economy and the recent global growth slowdown. That meeting was on January 22nd. Although current expectations are for the BOC to remain on hold once again, a lot has changed since their last meeting when crude oil was at 56.74. Phase One of the US-China Trade Deal was just signed a week earlier, and there wasn’t any talk of the coronavirus. Look how much can change in 6 weeks…they will have much to discuss!
USD/CAD has been in a symmetrical triangle since early 2016. At the end of 2019, price broke below the bottom, upward sloping trendline of the triangle (which dates back to 2012) and tested 1.3000. Price briefly traded into the 1.29 handle and bounced back into the apex of the triangle.
Source: Tradingview, FOREX.com
Notice on the 240-minute chart what happened at the last BOC meeting, when they turned from neutral to dovish. If they are even more dovish, price may continue higher! If price can close above current levels, there is horizonal resistance above at 1.3357. After that is the 127.2% Fibonacci extension from the highs on November 20th, 2019 to the lows on December 31st, at 1.3432. Above that is the 161.8% Fibonacci extension from the same time period which comes in at 1.3560. This also coincides with a previous peak in May of last year (on daily timeframe). Fist support is at todays lows of 1.3271. Below that, Friday’s lows near 1.3200 and then the highs on the move after the BOC meeting on January 22nd near 1.3150.
Source: Tradingview, FOREX.com
If crude does continue to move lower, one can expect USD/CAD to continue moving higher. In addition, if the BOC continues to be dovish at its interest rate decision meeting next week, USD/CAD also may continue higher. However, if crude starts to bounce (perhaps a relief bounce in the short term), USD/CAD could pull back, which may give traders another chance to buy before the BOC meeting.

The complete CFD trading experience
Award-winning platforms, competitive spreads, low commissions and dedicated support.
We live and breathe the markets and are dedicated to helping traders realise their ambitions as we continue to set the industry bar.
Economic calendar
Web Trader platform
Our sophisticated web-based platform is packed with features.
Related articles

USD into a Massive Week as Yields Fly and Gold Breaks
It’s a huge week with PCE and NFP, but it’s what’s happening off of the calendar that demands attention with US yields flying to fresh multi-decade highs.


USDJPY Forecast Intervention Fears Clash with Dollar Strength
Recent trading sessions have produced mixed results for the Japanese yen. By the end of last week, USD/JPY had fallen by more than 1.00%, reflecting a modest recovery in the yen. However, the start of this week has seen the pair move slightly back in favor of the U.S. dollar, posting gains of around 0.04%.


Nasdaq 100 Forecast: NDX falls as oil jumps and Treasury yields rise
U.S. stocks are pointing to a weaker open on Monday after President Trump rejected an Iranian ceasefire, sending oil prices higher and fuelling inflationary concerns and pushing Treasury yields higher.

StoneX Europe Ltd may make third party material available on this website which may contain information included but not limited to the conditions of financial markets. The material is for information purposes only and does not contain, and should not be construed as containing, investment advice and/or investment recommendation and/or an investment research and/or an offer of or solicitation for any transactions in financial instruments; any decision to enter into a specific transaction shall be made by the client following an assessment by him/her of their situation.
StoneX Europe Ltd makes no representation or warranty and assumes no liability as to the accuracy or completeness of the information provided, nor any loss arising from any investment based on a recommendation, forecast or other information supplied. You should always seek independent advice as to your suitability to speculate in any related markets and your ability to assume the associated risks, if you are at all unsure. We are not under any obligation to update any such material. Any opinion made may be personal to the author and may not reflect the opinion of StoneX Europe Ltd.