



USD/JPY Forecast: Can the yen maintain its strength?
The week begins with USD/JPY posting a gain of just over 0.5%. However, this mild recovery comes after the pair recorded a decline of nearly 3.00% over the previous five sessions.
Share this:

The week begins with USD/JPY posting a gain of just over 0.5%. However, this mild recovery comes after the pair recorded a decline of nearly 3.00% over the previous five sessions.
The recent bearish bias in favor of the yen is mainly explained by the loss of consistency in U.S. dollar strength, as well as the stability observed in Japanese bond yields, which have acted as key catalysts supporting demand for the yen in the short term. If this dynamic persists, selling pressure could continue to dominate USD/JPY price action in the coming sessions.


Japanese bonds show stability
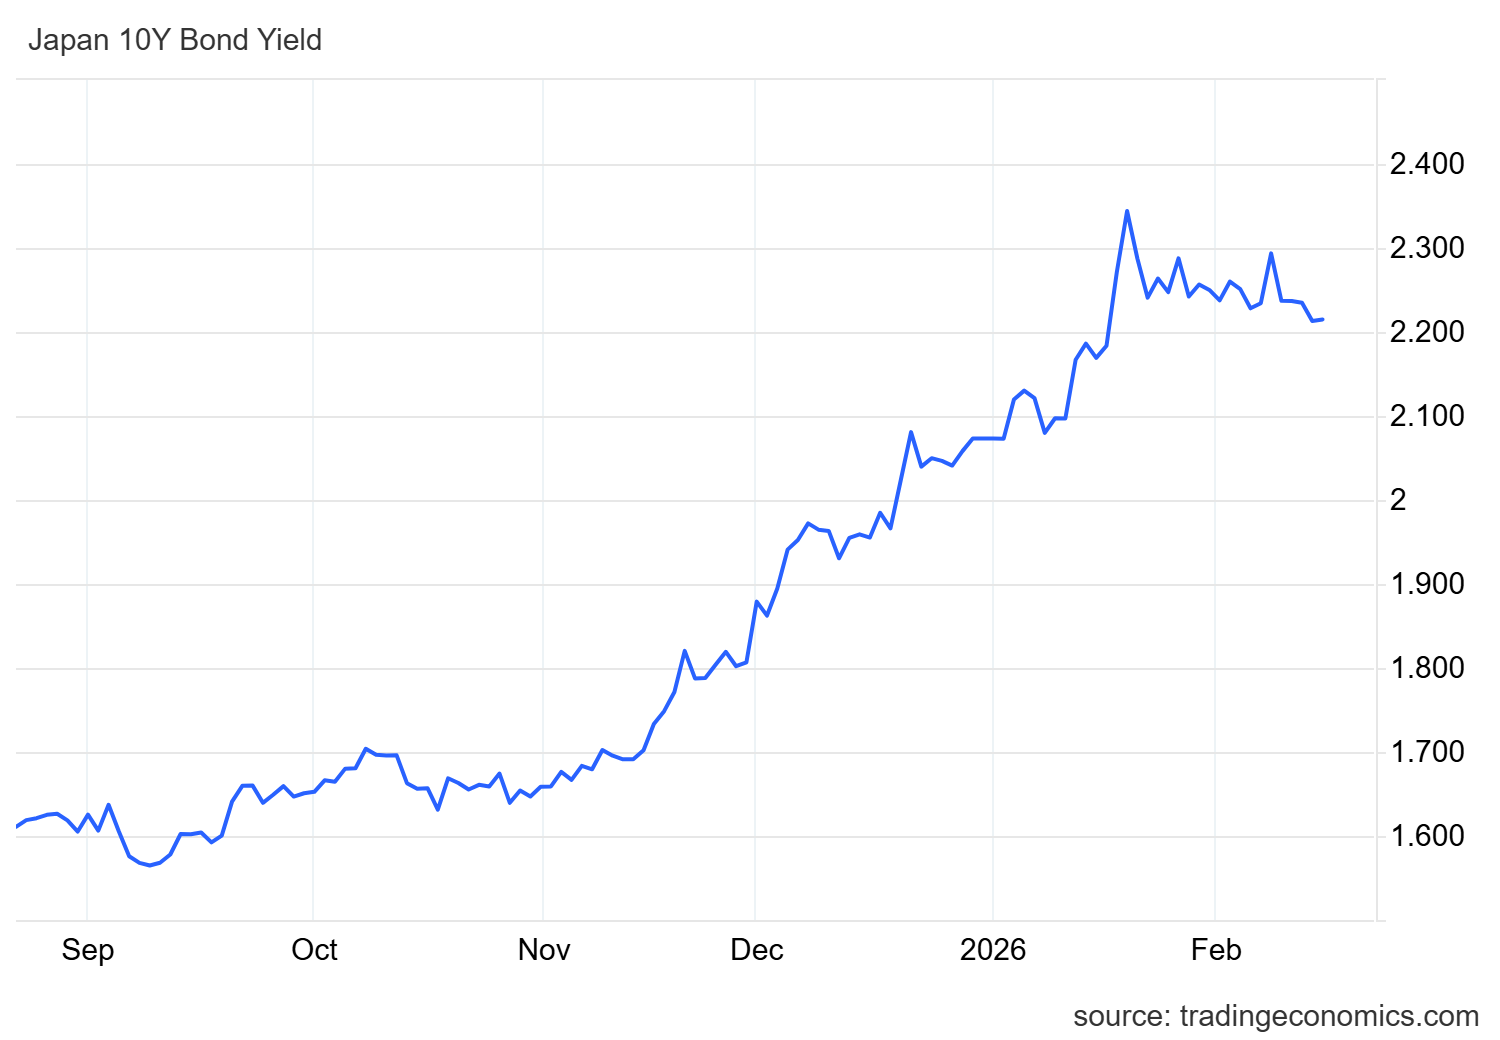
Despite the lack of recent updates from both the Japanese government and the Bank of Japan, 10-year Japanese bond yields have shown consistent stability. The yield currently remains above 2.21%, and although it has not returned to the recent high near 2.3%, it continues to trade at elevated levels compared to much of 2025.
This behavior suggests that the previous upward move in yields remains intact and that Japan’s fixed-income market retains a certain level of attractiveness. If this stability continues, it could encourage capital flows that support demand for the yen in the short term.
Source: TradingEconomics
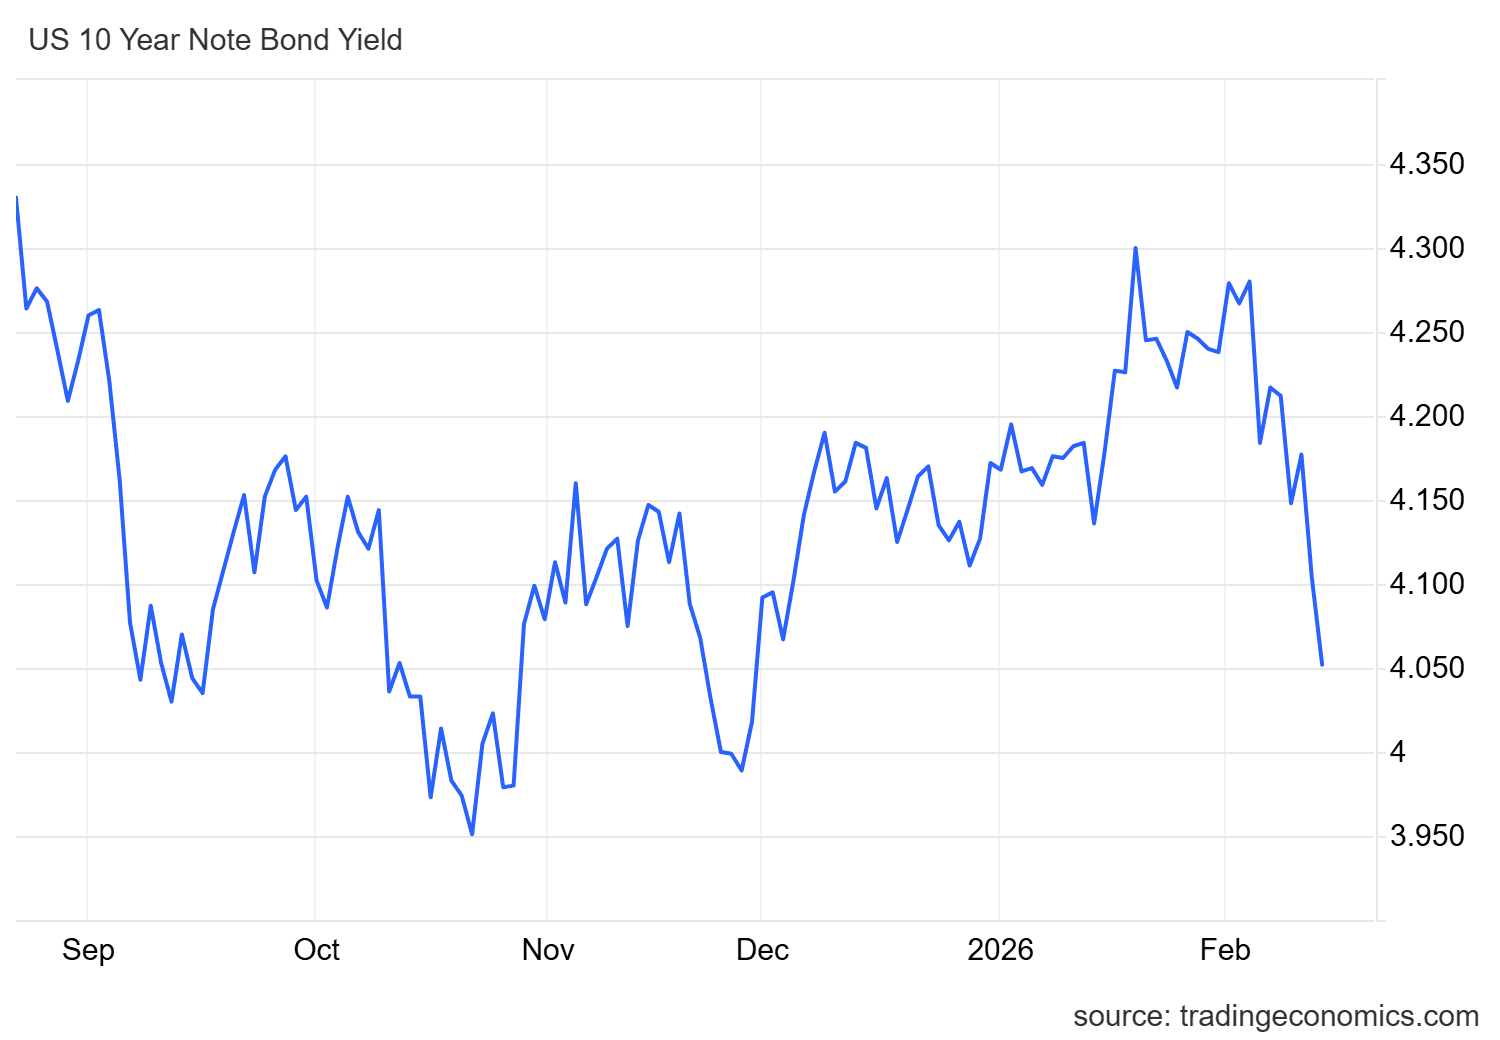
In contrast, U.S. 10-year Treasury yields are showing a different dynamic. The yield has pulled back toward the 4.00% area, moving away from the recent high near 4.3%. In fact, levels similar to—or even below—those seen in late 2025 are being observed again, reflecting a relative loss of attractiveness in the U.S. fixed-income market.
Source: TradingEconomics
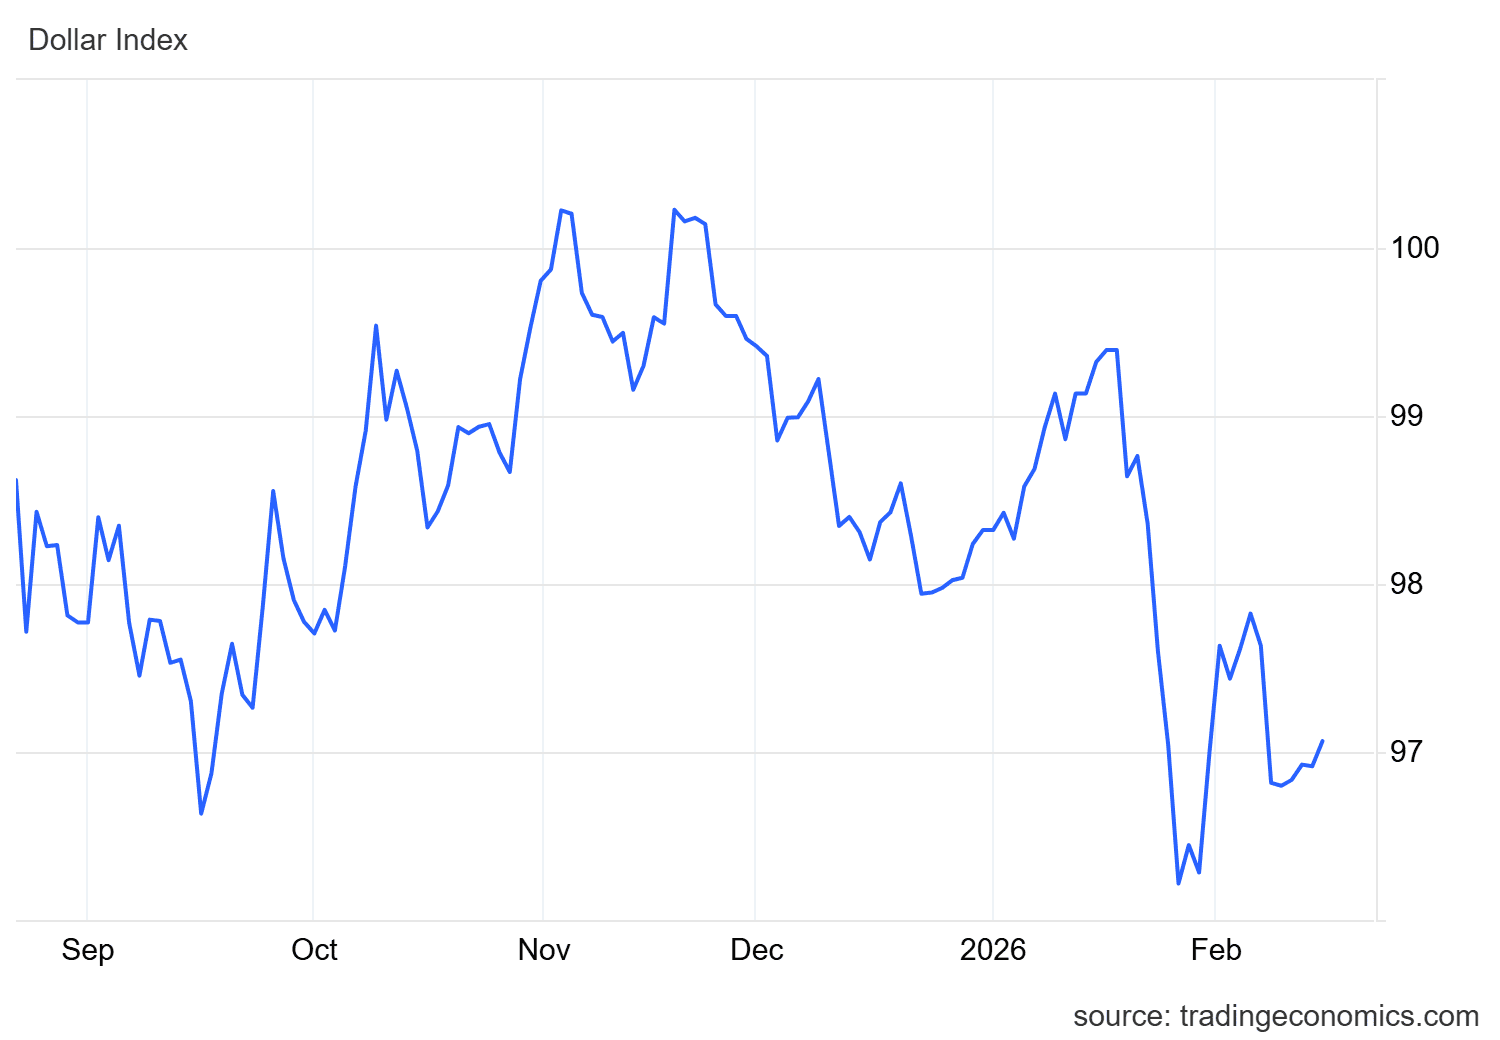
This behavior is already being reflected in dollar strength. The DXY index has posted a mild recovery toward the 97-point area but remains well below recent highs near 99, confirming that the dollar continues to experience structural weakness in the short term.
Source: TradingEconomics
Overall, the divergence between falling U.S. yields and stable Japanese yields may continue to favor the yen. If this dynamic holds, USD/JPY could remain under selling pressure in the coming sessions.
USD/JPY Technical Outlook
Source: StoneX, Tradingview
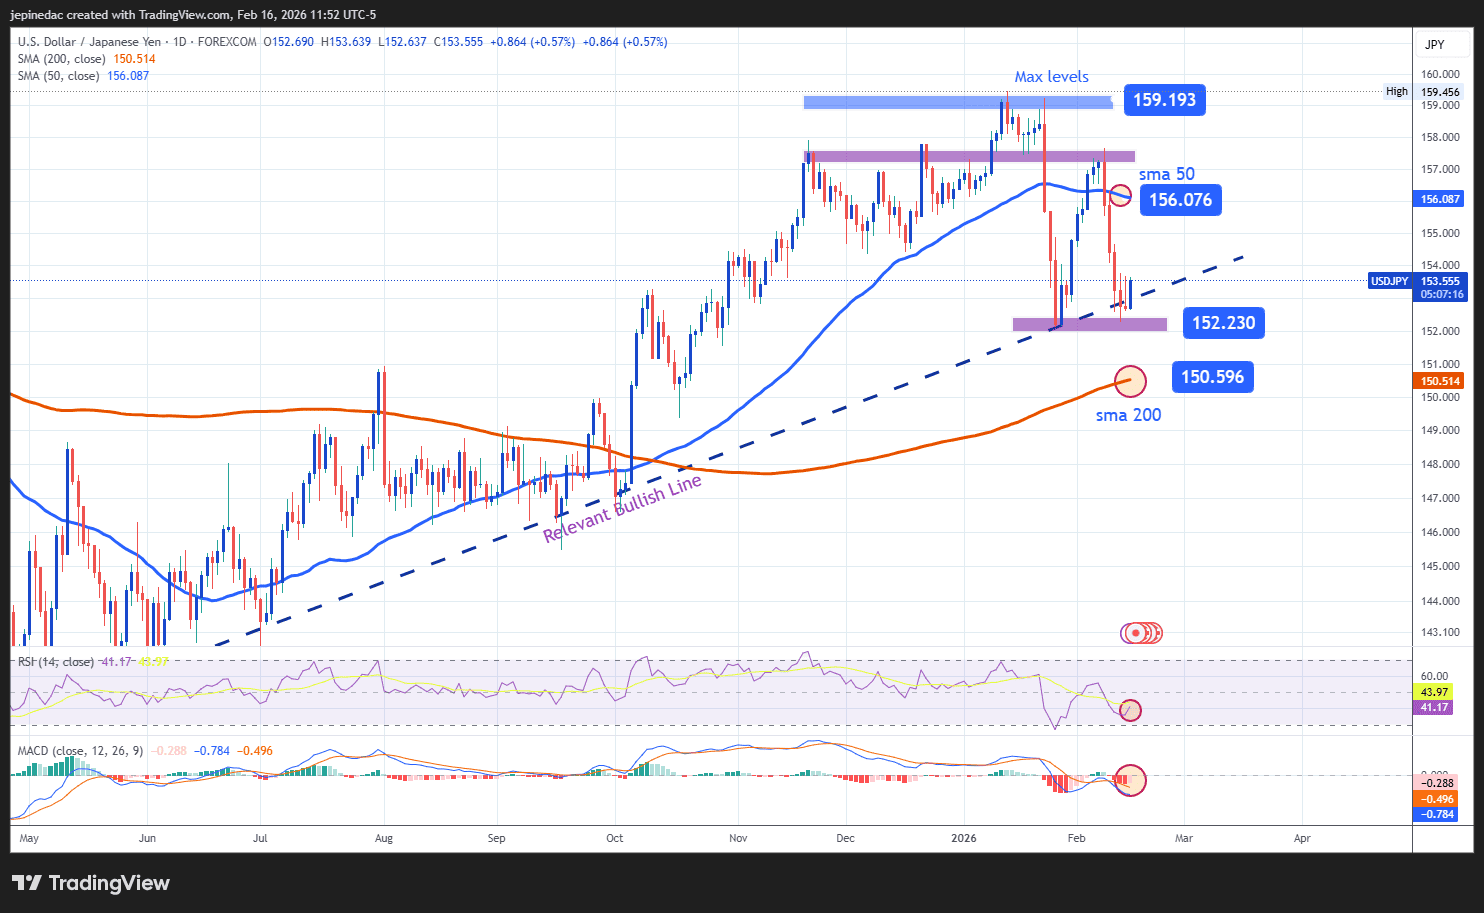
- The uptrend remains intact, at least for now: Since April 2025, USD/JPY has maintained a well-defined upward trendline that has dominated price behavior for several months. However, recent selling pressure has begun to call the strength of this structure into question, as prices have attempted to break below the trendline in the short term. If bearish pressure consolidates and persists over the next few sessions, the current bullish formation could come under threat, potentially giving way to a more dominant bearish bias in the near term.
- RSI: The RSI remains below the neutral 50 level, indicating that average selling momentum over the past 14 sessions continues to dominate. As long as this behavior persists, downside pressure may continue to play a key role in USD/JPY’s daily chart.
- MACD: The MACD also shows a negative bias, with the histogram below the zero line. This reflects that short-term moving averages continue to signal meaningful selling pressure. If this dynamic persists, it could reinforce bearish dominance in upcoming sessions.
Key Levels:
- 156.076 – Key resistance: Aligned with the 50-period simple moving average. Price action returning to this level could reactivate buying pressure and extend the prevailing uptrend.
- 152.230 – Near-term barrier: A level defined by recent lows. A sustained break below this zone could threaten the upward trendline and consolidate a more dominant bearish bias.
- 150.596 – Main support: Aligned with the 200-period simple moving average. A move toward this area could invalidate the current bullish structure and open the door to a new short-term bearish phase.
Written by Julian Pineda, CFA, CMT – Market Analyst
Follow him on: @julianpineda25
Related tags:



The complete CFD trading experience
Award-winning platforms, competitive spreads, low commissions and dedicated support.
We live and breathe the markets and are dedicated to helping traders realise their ambitions as we continue to set the industry bar.
Economic calendar
Web Trader platform
Our sophisticated web-based platform is packed with features.
Related articles

AUD/USD forecast: Currency Pair of the Week | September 28, 2026
The week has started with stocks, gold, silver and bitcoin all falling, as crude oil rebounded and bond yields pushed further higher. Trump refusing to agree to Tehran’s proposal to re-open the Strait of Hormuz has left the markets disappointed. Still, reports that mediators are expected to hold talks with the two sides on an amended version of the 7-day proposal that Iran presented, keeps hopes alive that we may see some progress.


EUR/USD weekly outlook: Oil, inflation and NFP in focus
After coming under significant pressure in recent weeks, the EUR/USD came off its lows to finish the week on a positive note on Friday, albeit with only a mild rebound. That was not enough to prevent the exchange rate falling for the third consecutive week, as the US dollar and bond yields rallied across the board.

USD/JPY Weekly Outlook: Payrolls loom as US rates remain the dominant driver
Strong US growth and hawkish Fed pricing continue to support USD/JPY, while intervention risk appears to be kicking in at lower levels

StoneX Europe Ltd may make third party material available on this website which may contain information included but not limited to the conditions of financial markets. The material is for information purposes only and does not contain, and should not be construed as containing, investment advice and/or investment recommendation and/or an investment research and/or an offer of or solicitation for any transactions in financial instruments; any decision to enter into a specific transaction shall be made by the client following an assessment by him/her of their situation.
StoneX Europe Ltd makes no representation or warranty and assumes no liability as to the accuracy or completeness of the information provided, nor any loss arising from any investment based on a recommendation, forecast or other information supplied. You should always seek independent advice as to your suitability to speculate in any related markets and your ability to assume the associated risks, if you are at all unsure. We are not under any obligation to update any such material. Any opinion made may be personal to the author and may not reflect the opinion of StoneX Europe Ltd.