






USDJPY Looks Ready for a Pickup in Volatility
FX markets have been quiet as they wait for the next catalyst.
Share this:

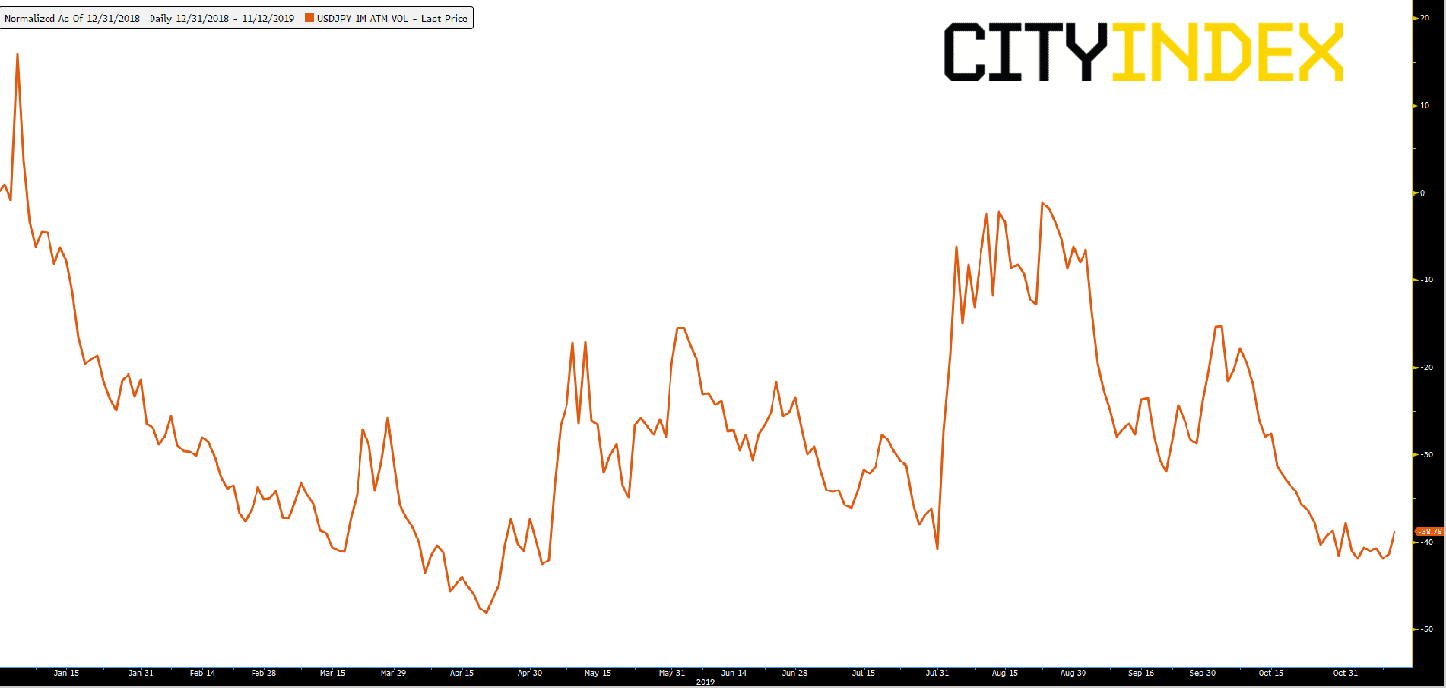
Over the last two days the FX markets have been fairly quiet as they wait for the next catalyst to offer some direction. However, it’s not just been the last two days that volatility has slowed! My colleague Ken provided me with a chart showing just how slow volatility has become over the last few months. The chart below shows USD/JPY 1 Month ATM implied vol rebased over year to date. In other words, the chart shows a decrease of volatility of roughly 40% since mid-August in USD/JPY. (Notice at the far right it has turned up recently.)
Source: Bloomberg, City Index
What could that next catalyst be for the markets? At 12:00pm EST, President Trump is set to speak at the New York Economic Club. One can imagine how upbeat he may be on the economy and although he is not expected to offer any new policies, the markets need to expect the unexpected from the “stock market friendly” President. Tomorrow the US also offers the October look at CPI and Fed Chairman Powell is set to testify on the economic outlook and recent monetary policy actions before the Joint Economic Committee. Hopefully one of these events will give us some volatility to trade.
What could some volatility do to USD/JPY? Many market participants are looking at the inverted head and shoulders pattern on a daily timeframe. The exact placement of the neckline is debatable; however it appears that if price breaks through the neckline near current levels, the target would be near 114.00. (A catalyst for a move such as this would be stock positive.) There is plenty of resistance though that USD/JPY would need to break through to reach the target, including the 61.8% retracement from the high on April 24th to the low on August 26th at 109.36, the gap fill from early May near 111.10, and the April 24th highs at 112.40.
Source: Tradingview, City Index
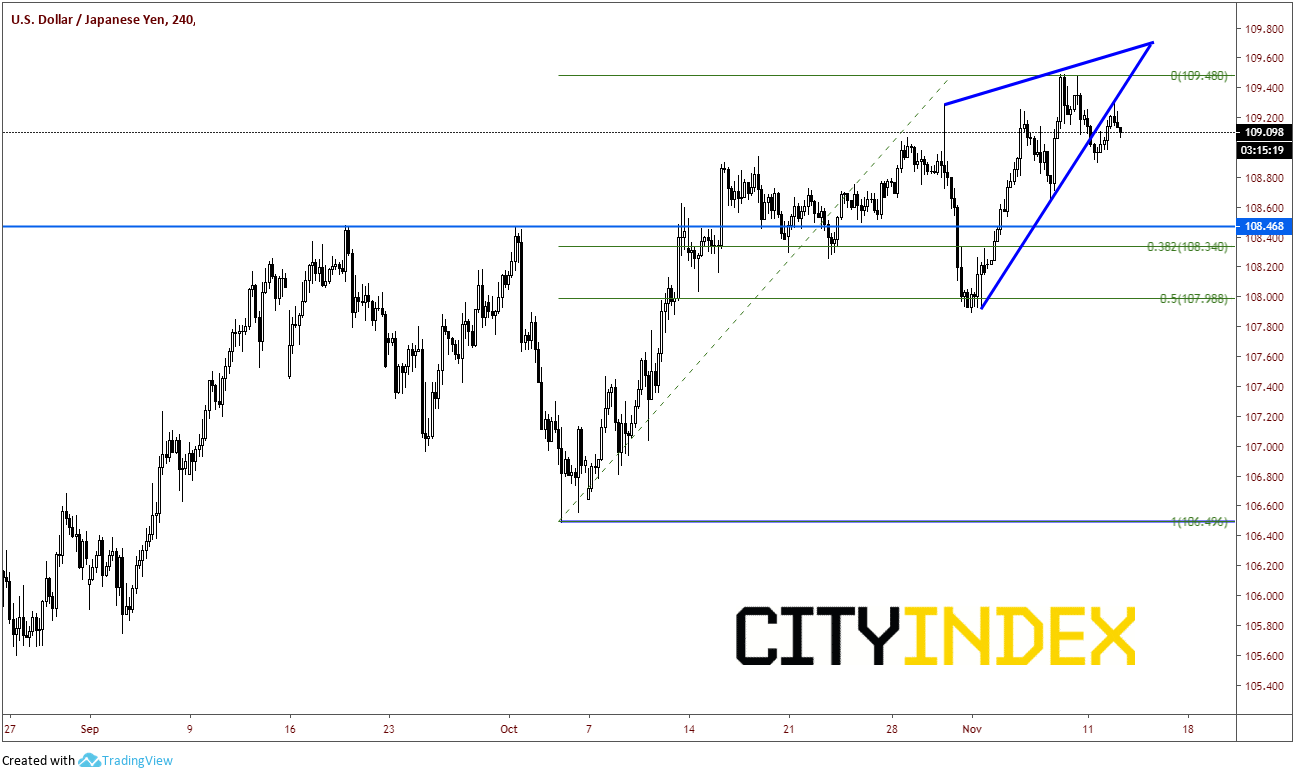
However, on a shorter 240-minute timeframe, is appears that price may have broken lower out of a rising wedge. If that is the case, the target for the breakdown of a rising wedge is a 100% retracement of the wedge, which is near 108.00 (A catalyst for a move such as this would be stock negative.) That level also coincides with the 50% retracement from the October 3rd lows to the 109.50 highs reached multiple times earlier this month. There is horizonal support lower near 108.50 and the 38.2% retracement of the previously mentioned timeframe at 108.34.
Source: Tradingview, City Index
Depending on your trading style and timeframe, with proper risk management, USD/JPY can be traded on either side of the market. However, the one thing we clearly need is volatility!
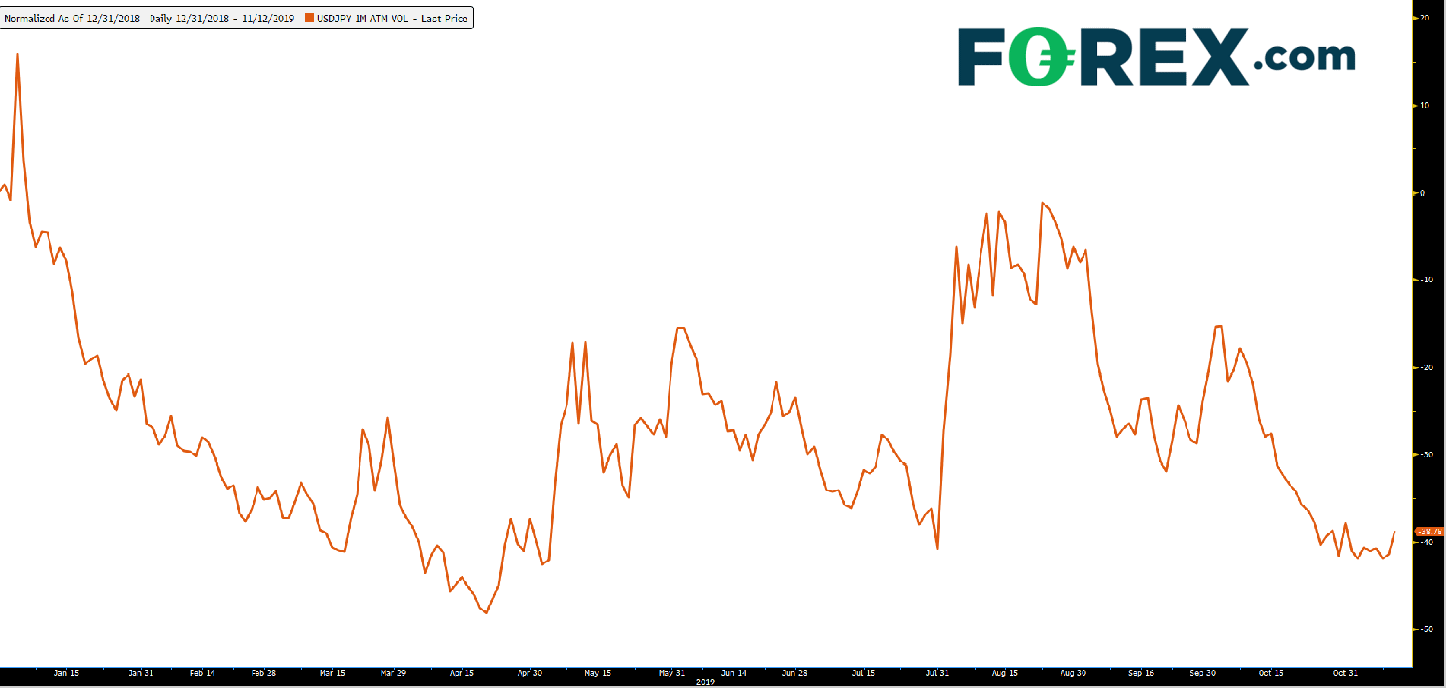
Over the last two days the FX markets have been fairly quiet as they wait for the next catalyst to offer some direction. However, it’s not just been the last two days that volatility has slowed! My colleague Ken provided me with a chart showing just how slow volatility has become over the last few months. The chart below shows USD/JPY 1 Month ATM implied vol rebased over year to date. In other words, the chart shows a decrease of volatility of roughly 40% since mid-August in USD/JPY. (Notice at the far right it has turned up recently.)
Source: Bloomberg, FOREX.com
What could that next catalyst be for the markets? At 12:00pm EST, President Trump is set to speak at the New York Economic Club. One can imagine how upbeat he may be on the economy and although he is not expected to offer any new policies, the markets need to expect the unexpected from the “stock market friendly” President. Tomorrow the US also offers the October look at CPI and Fed Chairman Powell is set to testify on the economic outlook and recent monetary policy actions before the Joint Economic Committee. Hopefully one of these events will give us some volatility to trade.
What could some volatility do to USD/JPY? Many market participants are looking at the inverted head and shoulders pattern on a daily timeframe. The exact placement of the neckline is debatable; however it appears that if price breaks through the neckline near current levels, the target would be near 114.00. (A catalyst for a move such as this would be stock positive.) There is plenty of resistance though that USD/JPY would need to break through to reach the target, including the 61.8% retracement from the high on April 24th to the low on August 26th at 109.36, the gap fill from early May near 111.10, and the April 24th highs at 112.40.
Source: Tradingview, FOREX.com
However, on a shorter 240-minute timeframe, is appears that price may have broken lower out of a rising wedge. If that is the case, the target for the breakdown of a rising wedge is a 100% retracement of the wedge, which is near 108.00 (A catalyst for a move such as this would be stock negative.) That level also coincides with the 50% retracement from the October 3rd lows to the 109.50 highs reached multiple times earlier this month. There is horizonal support lower near 108.50 and the 38.2% retracement of the previously mentioned timeframe at 108.34.
Source: Tradingview, FOREX.com
Depending on your trading style and timeframe, with proper risk management, USD/JPY can be traded on either side of the market. However, the one thing we clearly need is volatility!


The complete CFD trading experience
Award-winning platforms, competitive spreads, low commissions and dedicated support.
We live and breathe the markets and are dedicated to helping traders realise their ambitions as we continue to set the industry bar.
Economic calendar
Web Trader platform
Our sophisticated web-based platform is packed with features.
Related articles
USD/MXN Forecast: Peso Loses Momentum Ahead of Banxico Decision
Over recent trading sessions, the Mexican peso has started to show signs of losing strength against the U.S. dollar. This can be seen in the performance of USD/MXN, which has gained more than 1.7% over the last three sessions, highlighting the dollar's renewed strength against the peso.

Euro Short-term Outlook: EUR/USD Selloff Nears Critical Yearly Support 9 23 2026
Euro has fallen seven of the past nine sessions, with stretched momentum raising the stakes as EUR/USD closes in on a major inflection zone.


GBP/USD forecast: US dollar surges as bonds implode
The US dollar continued to press higher deep into the European session, supported by the slump in the bond markets as yields broke out across the curve. Following the recent hawkish Fed rate hike, yield spreads between the US and the rest of the world has continually increased, and that motion continued today, helped in part by some forecast-beating US macro data and hawkish Fed commentary.

StoneX Europe Ltd may make third party material available on this website which may contain information included but not limited to the conditions of financial markets. The material is for information purposes only and does not contain, and should not be construed as containing, investment advice and/or investment recommendation and/or an investment research and/or an offer of or solicitation for any transactions in financial instruments; any decision to enter into a specific transaction shall be made by the client following an assessment by him/her of their situation.
StoneX Europe Ltd makes no representation or warranty and assumes no liability as to the accuracy or completeness of the information provided, nor any loss arising from any investment based on a recommendation, forecast or other information supplied. You should always seek independent advice as to your suitability to speculate in any related markets and your ability to assume the associated risks, if you are at all unsure. We are not under any obligation to update any such material. Any opinion made may be personal to the author and may not reflect the opinion of StoneX Europe Ltd.