




USDJPY technical analysis Longterm outlook still favors bears
The path of least resistance for USD/JPY remains to the downside as long as the bearish channel remains intact
Share this:

When it comes to the FX market, traders are often more focused on risk appetite and trends in the global economy than the specific countries underlying each currency. For example, EUR/USD often falls (indicating relative weakness in the euro and strength in the US) after weaker-than-expected US data because traders fear that slowing US growth will eventually spill across the rest of the globe, creating an “risk off” environment where the US dollar’s safe haven status will be in demand.
As a pairing of arguably the planet’s two most important “safe haven” currencies, USD/JPY usually sidesteps this confusing dynamic and serves as purer measure of the relative attractiveness of each currency. In other words, examining the trends in USD/JPY provides valuable insight into how traders are viewing the US dollar and Japanese yen in isolation.
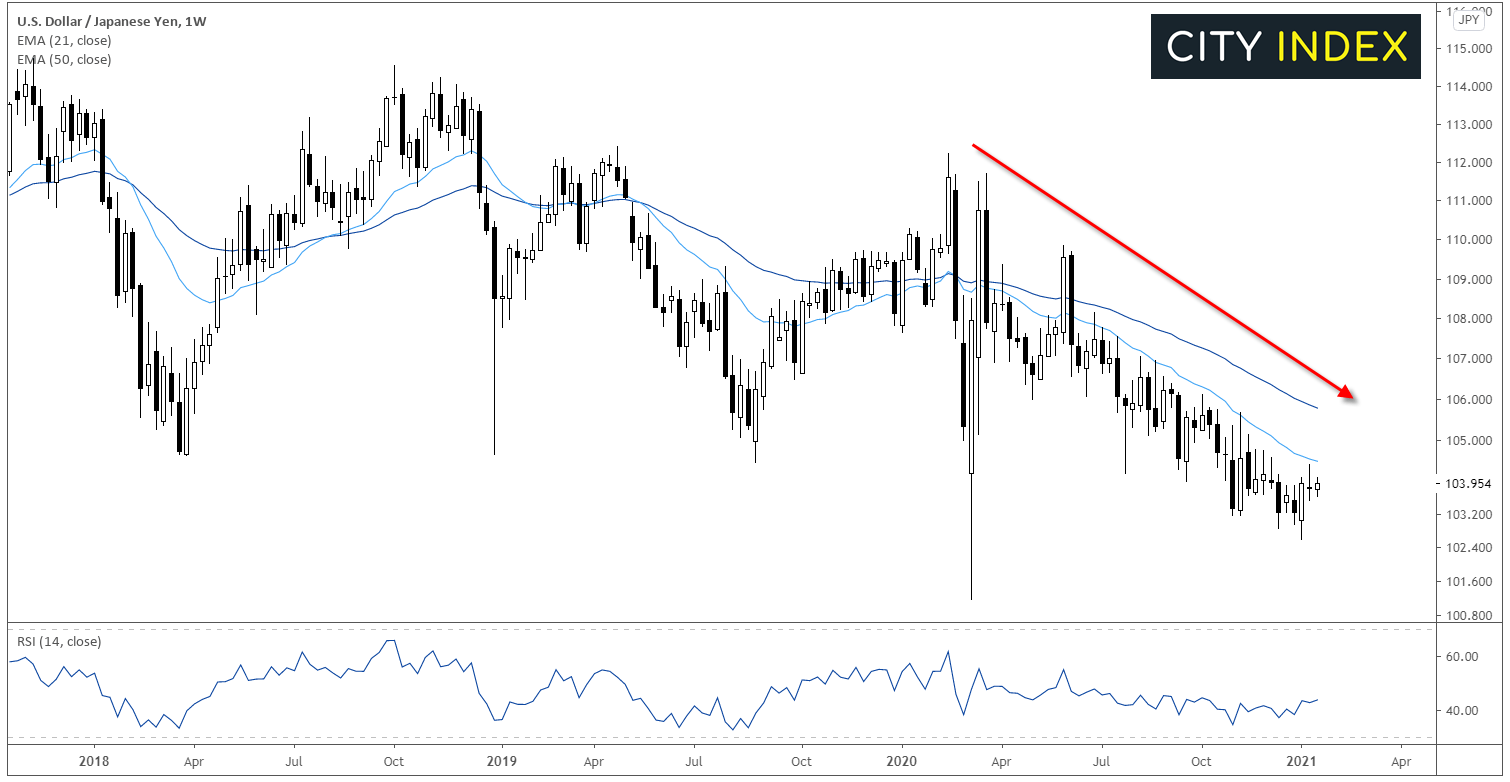
Turning our attention to the pair’s weekly chart, it’s clear that while traders are still bearish on the US dollar relative to the yen, the strength of the move is far more subdued than in other crosses. This tells us that the US dollar’s weakness over the last year has been due to increasing risk appetite first and foremost, with specific concerns about the US economy playing a smaller role. Nonetheless, USD/JPY remains in a bearish trend on a longer-term timeframe, with rates trending lower below both the 21- and 50-week EMAs:
Source: TradingView, GAIN Capital
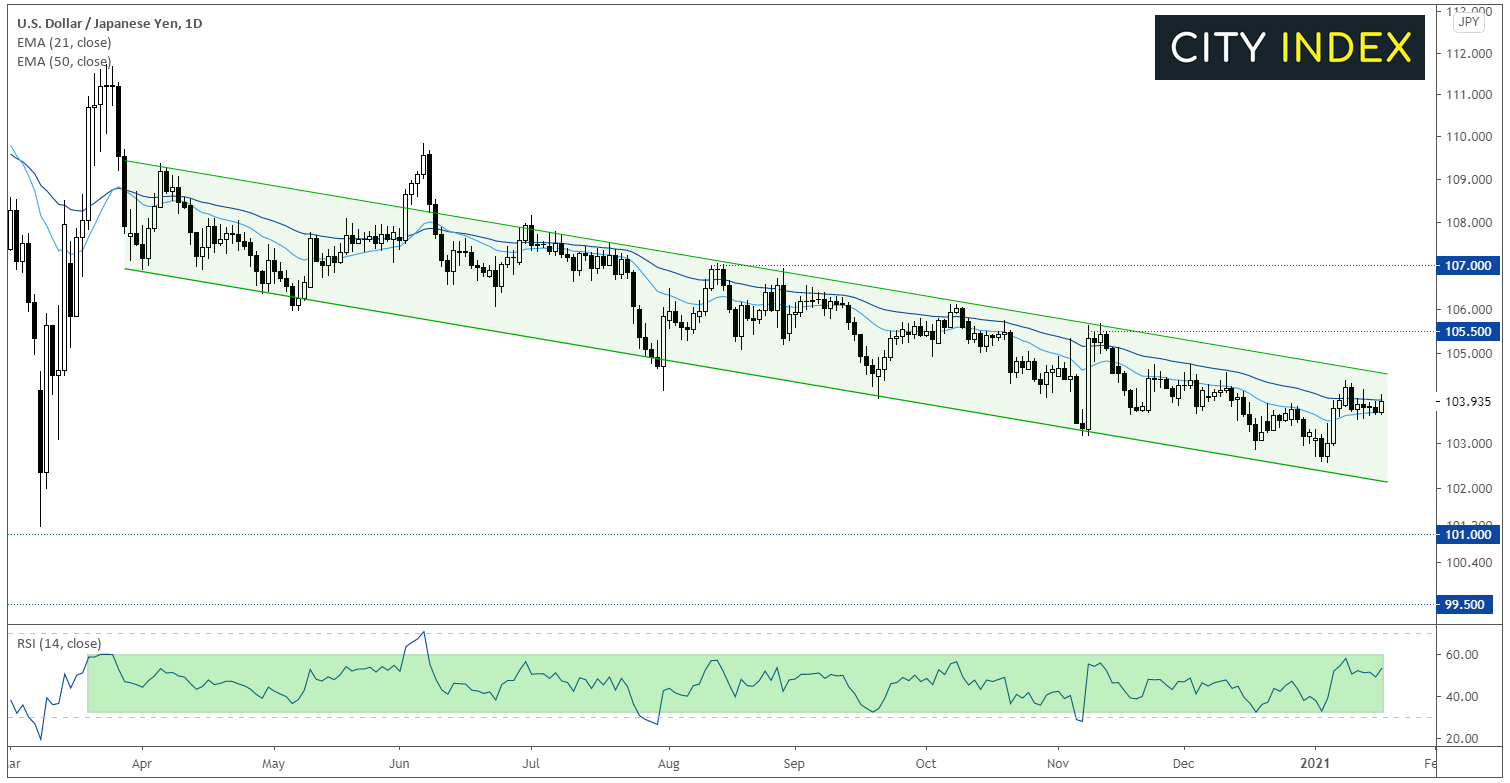
Zooming in to a daily chart, we can see the slow-but-steady decline in more detail. Rates have been almost entirely contained to a 250-pip descending channel since late March, with near-term bounces to the top of the range offering potential sell opportunities to bears and drops to the bottom of the channel serving as logical areas to take profits:
Source: TradingView, GAIN Capital
Moving forward, the path of least resistance remains to the downside as long as the bearish channel remains intact. From that perspective, readers may want to consider short opportunities on bounces toward the top of the channel, currently around 104.50, with downside potential toward the COVID pandemic trough near 101.00, psychological support at 100.00, or even the 7-year low near 99.50 as we move through the quarter.
A bullish breakout from the downtrend channel would open the door for a stronger retracement, with bulls potentially targeting the November or August highs around 105.50 and 107.00 respectively.
Learn more about forex trading opportunities.
When it comes to the FX market, traders are often more focused on risk appetite and trends in the global economy than the specific countries underlying each currency. For example, EUR/USD often falls (indicating relative weakness in the euro and strength in the US) after weaker-than-expected US data because traders fear that slowing US growth will eventually spill across the rest of the globe, creating an “risk off” environment where the US dollar’s safe haven status will be in demand.
As a pairing of arguably the planet’s two most important “safe haven” currencies, USD/JPY usually sidesteps this confusing dynamic and serves as purer measure of the relative attractiveness of each currency. In other words, examining the trends in USD/JPY provides valuable insight into how traders are viewing the US dollar and Japanese yen in isolation.
Turning our attention to the pair’s weekly chart, it’s clear that while traders are still bearish on the US dollar relative to the yen, the strength of the move is far more subdued than in other crosses. This tells us that the US dollar’s weakness over the last year has been due to increasing risk appetite first and foremost, with specific concerns about the US economy playing a smaller role. Nonetheless, USD/JPY remains in a bearish trend on a longer-term timeframe, with rates trending lower below both the 21- and 50-week EMAs:
Source: TradingView, GAIN Capital
Zooming in to a daily chart, we can see the slow-but-steady decline in more detail. Rates have been almost entirely contained to a 250-pip descending channel since late March, with near-term bounces to the top of the range offering potential sell opportunities to bears and drops to the bottom of the channel serving as logical areas to take profits:
Source: TradingView, GAIN Capital
Moving forward, the path of least resistance remains to the downside as long as the bearish channel remains intact. From that perspective, readers may want to consider short opportunities on bounces toward the top of the channel, currently around 104.50, with downside potential toward the COVID pandemic trough near 101.00, psychological support at 100.00, or even the 7-year low near 99.50 as we move through the quarter.
A bullish breakout from the downtrend channel would open the door for a stronger retracement, with bulls potentially targeting the November or August highs around 105.50 and 107.00 respectively.
Learn more about forex trading opportunities.
Latest market news




The complete CFD trading experience
Award-winning platforms, competitive spreads, low commissions and dedicated support.
We live and breathe the markets and are dedicated to helping traders realise their ambitions as we continue to set the industry bar.
Economic calendar
Web Trader platform
Our sophisticated web-based platform is packed with features.
Related articles
EUR/USD Q4 2026 Outlook: Euro at a Crossroads as Fed, ECB Tighten 9 25 2026
EUR/USD enters Q4 at a pivotal inflection point as competing Fed-ECB policy paths and persistent inflation risks collide with major technical support.

USD/JPY Q4 2026 Outlook: Hawkish Fed Pricing Clashes With Intervention Risk
The year-end tug-of-war is clear: hawkish Fed pricing supports USD/JPY, while intervention risk limits the upside.


Japanese Yen Forecast: USD/JPY 4% Rally Challenges Post-Intervention Downtrend 9 24 2026
USD/JPY momentum has shifted sharply higher, putting a major resistance confluence in focus as U.S. and Japanese event risk builds.
StoneX Europe Ltd may make third party material available on this website which may contain information included but not limited to the conditions of financial markets. The material is for information purposes only and does not contain, and should not be construed as containing, investment advice and/or investment recommendation and/or an investment research and/or an offer of or solicitation for any transactions in financial instruments; any decision to enter into a specific transaction shall be made by the client following an assessment by him/her of their situation.
StoneX Europe Ltd makes no representation or warranty and assumes no liability as to the accuracy or completeness of the information provided, nor any loss arising from any investment based on a recommendation, forecast or other information supplied. You should always seek independent advice as to your suitability to speculate in any related markets and your ability to assume the associated risks, if you are at all unsure. We are not under any obligation to update any such material. Any opinion made may be personal to the author and may not reflect the opinion of StoneX Europe Ltd.