



Weekly COT Report: Bearish exposure to AUD hits a new record
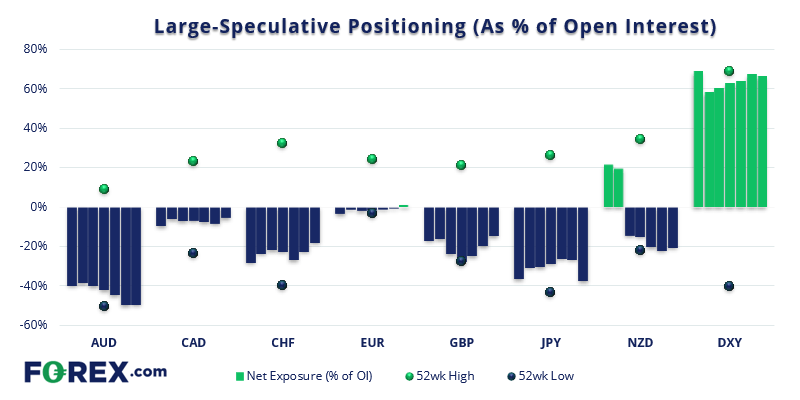
AT -91.5k contracts net-short, it is the most aggressively bearish exposure on AUD futures by large speculators on record.
Share this:
As of Tuesday 11th January 2022:
- Traders increased bullish exposure to USD by $0.42 billion, according to IMM
- Traders flipped to net-long exposure to euro futures
- Net-short exposure to AUD futures hit a new record
- Large speculators increased net-short exposure to yen futures to a 6-week high

Read our guide on how to interpret the weekly COT report
Read our guide on how to interpret the weekly COT report
AUD futures:
Traders sold short 1.8k contracts against the Australian dollar and trimmed longs by -249 contracts, which takes the net-sort exposure to a new record of -91.5k contracts. Whilst shorts rose a little last week, the increase of short exposure has mainly been a function of longs being closed out since the end of November. Yet despite the bearish exposure to AUD prices continue to hold up well overall, which means we need to see prices roll over or bears will be forced to close and potentially spark a short-covering rally (like we’ve seen on GBP futures recently).
Read our guide on the Australian Dollar
Read our guide on the Australian Dollar


EUR futures:
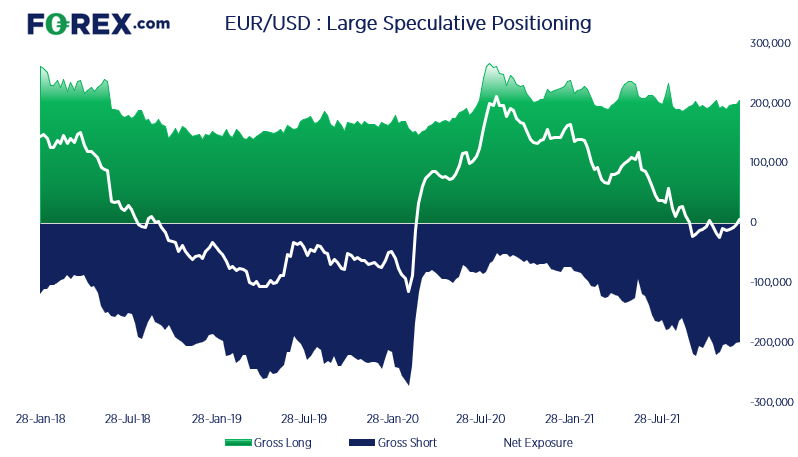
Traders flipped to net-long exposure on euro futures by 6 contracts. Yet we note there is a lot of trading activity in both directions, with longs and shorts sitting around 200k contracts each, so it appears investors are hedging their bets. So for a sustainable move to materialise we’d need to see a significant reduction in longs or shorts, as opposed to newly initiated activity.

JPY futures:
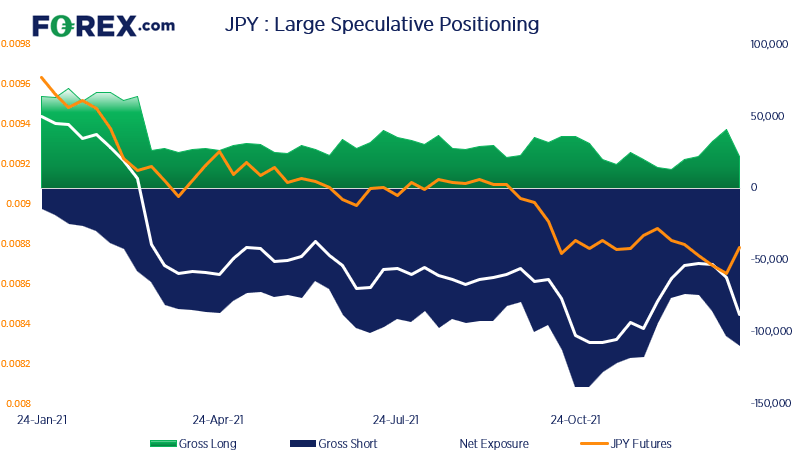
Last week traders closed 18.4k long contracts on yen futures and added 6.8k short contracts, which saw net-short exposure increase by 25.3k contracts. Yet prices went on to rally 1.48%, most of which was seen on Wednesday – a day after the report was compiled. So we have to assume some of those shorts have since been closed.

As of Tuesday 11th January 2022:
- Traders increased net-long exposure to WTI futures by 27.7k contracts
- Large speculators trimmed net-long exposure to gold futures by -11.6k contracts
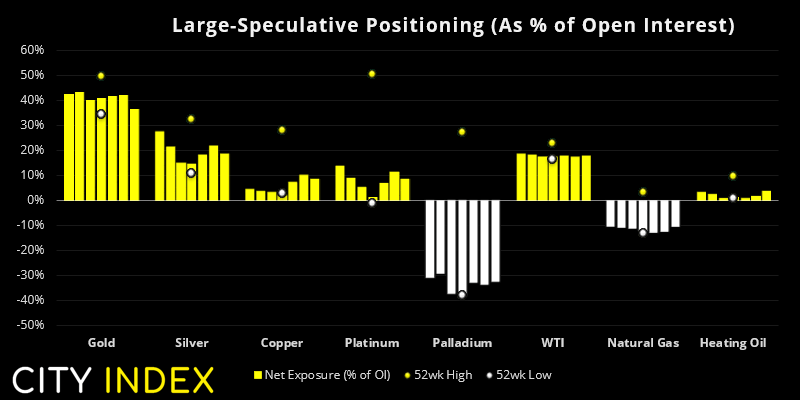
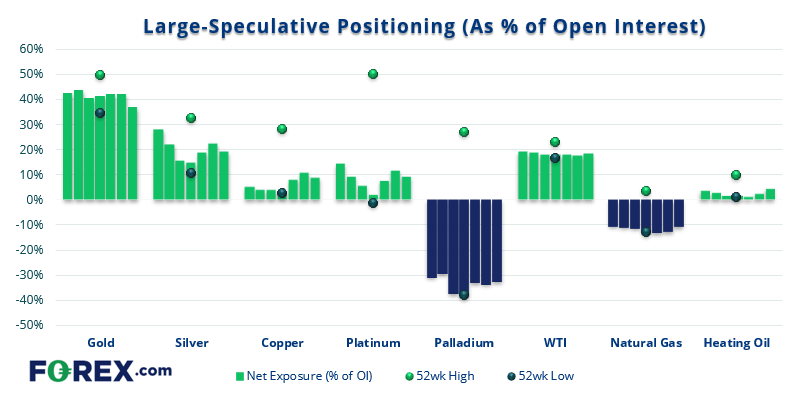
WTI futures:
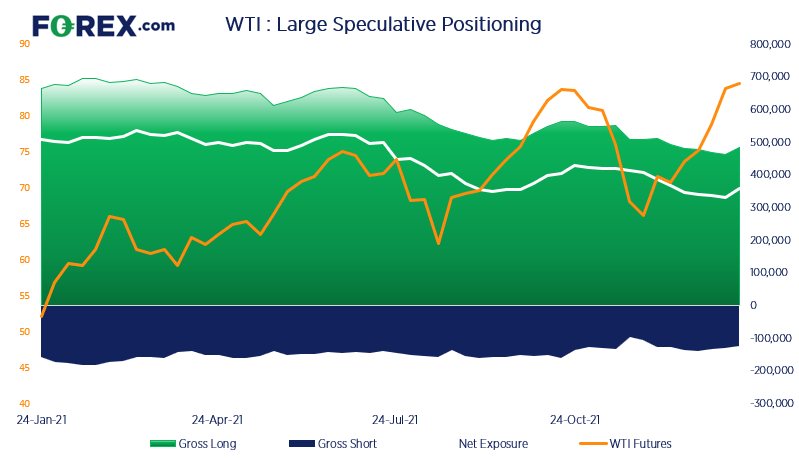
Traders increased their net-long exposure to WTI futures by 27.7k contracts last week, which is the most bullish weekly increase in 13-months. As gross logs have been trending lower for about a year it raises the odds that net-long positioning has seen a trough, and oil prices could potentially rally from here.

How to trade with City Index
You can easily trade with City Index by using these four easy steps:
- Open an account, or log in if you’re already a customer
• Open an account in the UK
• Open an account in Australia
• Open an account in Singapore
- Search for the company you want to trade in our award-winning platform
- Choose your position and size, and your stop and limit levels
- Place the trade
Latest market news




The complete CFD trading experience
Award-winning platforms, competitive spreads, low commissions and dedicated support.
We live and breathe the markets and are dedicated to helping traders realise their ambitions as we continue to set the industry bar.
Economic calendar
Web Trader platform
Our sophisticated web-based platform is packed with features.
Related articles
Gold Analysis: XAU/USD Ends the Week Without a Clear Trend
The trading week is coming to an end, and a sense of neutrality remains evident around gold's short-term price action. Over the last five trading sessions, the metal has posted a move of barely -0.3%, a situation that continues to highlight a growing phase of indecision and reflects a clear lack of direction across the market.
Swiss Franc Forecast: USD/CHF Seven-Week Rally Reverses From Yearly Highs 10 16 2026
A sharp rejection from fresh highs has shifted momentum in favor of USD/CHF bears, raising the stakes for a critical support test.


EUR/USD, GBP/USD Price Outlook: Can the Dollar Pullback Fuel a Bullish Rebound?
Could EUR/USD and GBP/USD be confirming a bullish rebound? The DXY’s pullback from the 103 resistance level may support a recovery in both pairs, although confirmation is still needed.

StoneX Europe Ltd may make third party material available on this website which may contain information included but not limited to the conditions of financial markets. The material is for information purposes only and does not contain, and should not be construed as containing, investment advice and/or investment recommendation and/or an investment research and/or an offer of or solicitation for any transactions in financial instruments; any decision to enter into a specific transaction shall be made by the client following an assessment by him/her of their situation.
StoneX Europe Ltd makes no representation or warranty and assumes no liability as to the accuracy or completeness of the information provided, nor any loss arising from any investment based on a recommendation, forecast or other information supplied. You should always seek independent advice as to your suitability to speculate in any related markets and your ability to assume the associated risks, if you are at all unsure. We are not under any obligation to update any such material. Any opinion made may be personal to the author and may not reflect the opinion of StoneX Europe Ltd.