







Weekly COT Report Gold Bugs Retreat Just Off Record Highs
A summary of the weekly Commitment of Traders Report (COT) from CFTC to show market positioning among large speculators.
Share this:

As of Tuesday 1st October:
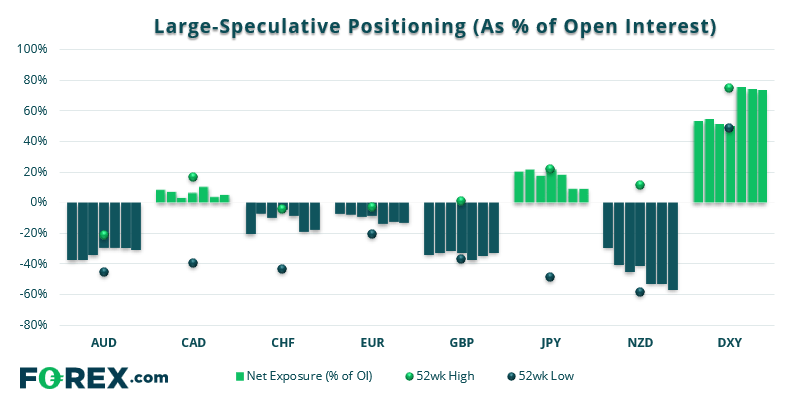
- Bullish exposure on the USD was at $17.5 billion ($20.5 billion against G10 FX)
- Overall, only minor adjustments were made to FX majors on a weekly basis
- Net-long exposure to the USD index (DXY) hit a 2.5 year high
- Net-short exposure nudged its way to a fresh record high, although fuelled by a close of longs and shorts
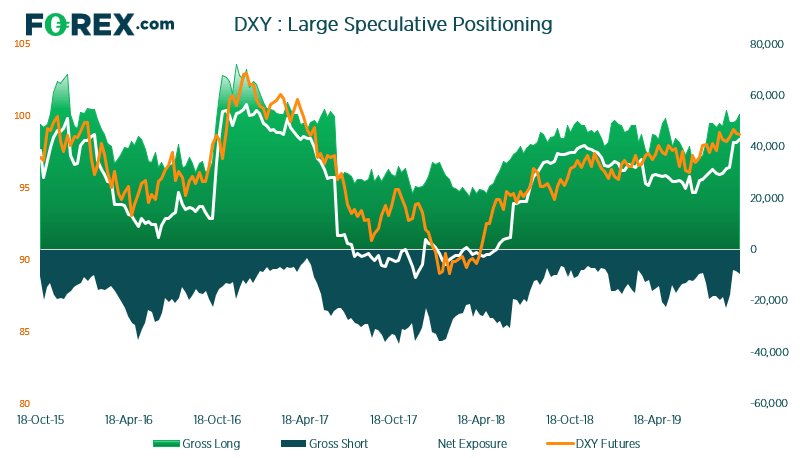
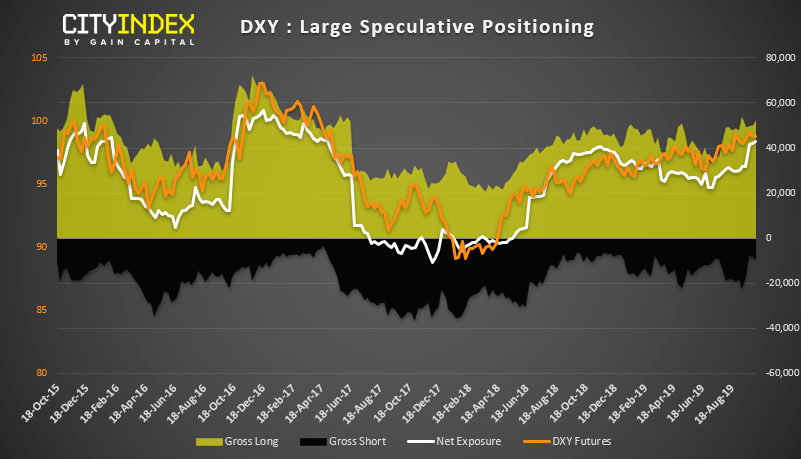
DXY: By Tuesday’s close, net-long exposure to DXY was its highest in 2.5 years. It’s 1-year Z-score was over +2 standard deviations foe the first time in 12 months. There were also 5.5 long contracts to every short, although this ratio actually peaked at 6.3 two weeks prior. However, this marketed the swing high and DXY has since retraced from its peak, so these metrics will be a little less stretched. From a price action perspective, DXY remain within a bullish channel and the its structure remains bullish above 98.6 so whilst this level holds, we favour a break to new highs.
As of Tuesday 1st October:
- Net-long exposure to gold was reduced by -11.6%
- Platinum traders reduced net-long exposure by 10.5%
- Bullish exposure to palladium hit a 3-month high
Gold: Gold bulls closed 47.6k long contracts last week, their largest weekly reduction since December 2017. This saw net-long exposure drop by 11.6%. Incidentally, the report (which was compiled on 1st October) marked the swing low on Gold. It’s also worth noting that net-long exposure was near record highs ahead of the bullish reduction. (The record high was in 2016). Whilst we’ve observed stretched positioning and warned of a potential inflection point, geopolitical tensions and weak economic data has proven too difficult to build a bear case for the yellow metal. But if those supportive features were to be removed, it then opens up the potential for a deeper correction. For now, gold could remain stubbornly near its highs and trade within a range.
Palladium: Traders have remained net-long on palladium since 2003. However, whilst prices remain at record highs, net-long exposure isn’t flagging a sentiment extreme with 1 and 3-year Z-score at +1.3 and -0.2 standard deviations respectively. Until price action suggests otherwise, palladium appears favourable to trend traders (or those seeking to buy dips).
As of Tuesday 1st October:
- Bullish exposure on the USD was at $17.5 billion ($20.5 billion against G10 FX)
- Overall, only minor adjustments were made to FX majors on a weekly basis
- Net-long exposure to the USD index (DXY) hit a 2.5 year high
- Net-short exposure nudged its way to a fresh record high, although fuelled by a close of longs and shorts
DXY: By Tuesday’s close, net-long exposure to DXY was its highest in 2.5 years. It’s 1-year Z-score was over +2 standard deviations foe the first time in 12 months. There were also 5.5 long contracts to every short, although this ratio actually peaked at 6.3 two weeks prior. However, this marketed the swing high and DXY has since retraced from its peak, so these metrics will be a little less stretched. From a price action perspective, DXY remain within a bullish channel and the its structure remains bullish above 98.6 so whilst this level holds, we favour a break to new highs.
As of Tuesday 1st October:
- Net-long exposure to gold was reduced by -11.6%
- Platinum traders reduced net-long exposure by 10.5%
- Bullish exposure to palladium hit a 3-month high
Gold: Gold bulls closed 47.6k long contracts last week, their largest weekly reduction since December 2017. This saw net-long exposure drop by 11.6%. Incidentally, the report (which was compiled on 1st October) marked the swing low on Gold. It’s also worth noting that net-long exposure was near record highs ahead of the bullish reduction. (The record high was in 2016). Whilst we’ve observed stretched positioning and warned of a potential inflection point, geopolitical tensions and weak economic data has proven too difficult to build a bear case for the yellow metal. But if those supportive features were to be removed, it then opens up the potential for a deeper correction. For now, gold could remain stubbornly near its highs and trade within a range.
Palladium: Traders have remained net-long on palladium since 2003. However, whilst prices remain at record highs, net-long exposure isn’t flagging a sentiment extreme with 1 and 3-year Z-score at +1.3 and -0.2 standard deviations respectively. Until price action suggests otherwise, palladium appears favourable to trend traders (or those seeking to buy dips).
Latest market news




The complete CFD trading experience
Award-winning platforms, competitive spreads, low commissions and dedicated support.
We live and breathe the markets and are dedicated to helping traders realise their ambitions as we continue to set the industry bar.
Economic calendar
Web Trader platform
Our sophisticated web-based platform is packed with features.
Related articles
Australian Dollar Technical Outlook: AUD/USD Breakdown Threatens Deeper Correction 9 23 2026
AUD/USD remains under pressure after breaking key trend support, with the latest decline putting the focus on the next major downside pivot.

Wall Street Forecast: DJIA rises on hawkish Fed expectations & rising yields
U.S. stocks are opening lower on Wednesday, pressured by higher crude oil prices and rising government bond yields, as investors await further developments from negotiations in the Middle East and ahead of a key U.S.-China summit.

USD/JPY forecast: US dollar strengths amid hawkish Fed despite recent oil weakness
The US dollar has extended its gains this morning, even if oil prices finished lower for the fifth consecutive day yesterday. Oil prices have bounced back in this first half of today’s session, causing a bit of pressure on currencies that rely on energy imports such as the euro, pound, Swiss franc, and Japanese yen. But it was the dollar that was exerting the most pressure, amid hawkish FedSpeak. Meanwhile, European indices and precious metals were also under a bit of pressure amid the strength of the dollar.

StoneX Europe Ltd may make third party material available on this website which may contain information included but not limited to the conditions of financial markets. The material is for information purposes only and does not contain, and should not be construed as containing, investment advice and/or investment recommendation and/or an investment research and/or an offer of or solicitation for any transactions in financial instruments; any decision to enter into a specific transaction shall be made by the client following an assessment by him/her of their situation.
StoneX Europe Ltd makes no representation or warranty and assumes no liability as to the accuracy or completeness of the information provided, nor any loss arising from any investment based on a recommendation, forecast or other information supplied. You should always seek independent advice as to your suitability to speculate in any related markets and your ability to assume the associated risks, if you are at all unsure. We are not under any obligation to update any such material. Any opinion made may be personal to the author and may not reflect the opinion of StoneX Europe Ltd.