






What Does the Gold Market Know
As soon as the statement was released, gold began to go bid
Share this:

The FOMC left rates unchanged today, targeting the 1.5%-1.75% range, as expected. The only small change the Fed made was to raise the IOER rate by 0.05% and announced that they would be extending repo operations until April. Otherwise, the statement and the press conference were….boring (for lack of a better word). However, as soon as the statement was released, gold began to go bid:
Source: Tradingview, COMEX, City Index
Perhaps it was just back to business as usual. Below is the base chart I’ve been using for Gold. It’s the daily futures chart, which has broken out of a flag pattern and is currently on its way to target near 1723. Price had paused along the way and the RSI moved to extreme overbought territory (above 80). They slight pullback gave the RSI room to unwind back into neutral territory.
Source: Tradingview, COMEX, City Index
Maybe someone knew early that Google was going to announce that they temporarily going to close all office in China due to the Coronavirus (source: Verge).
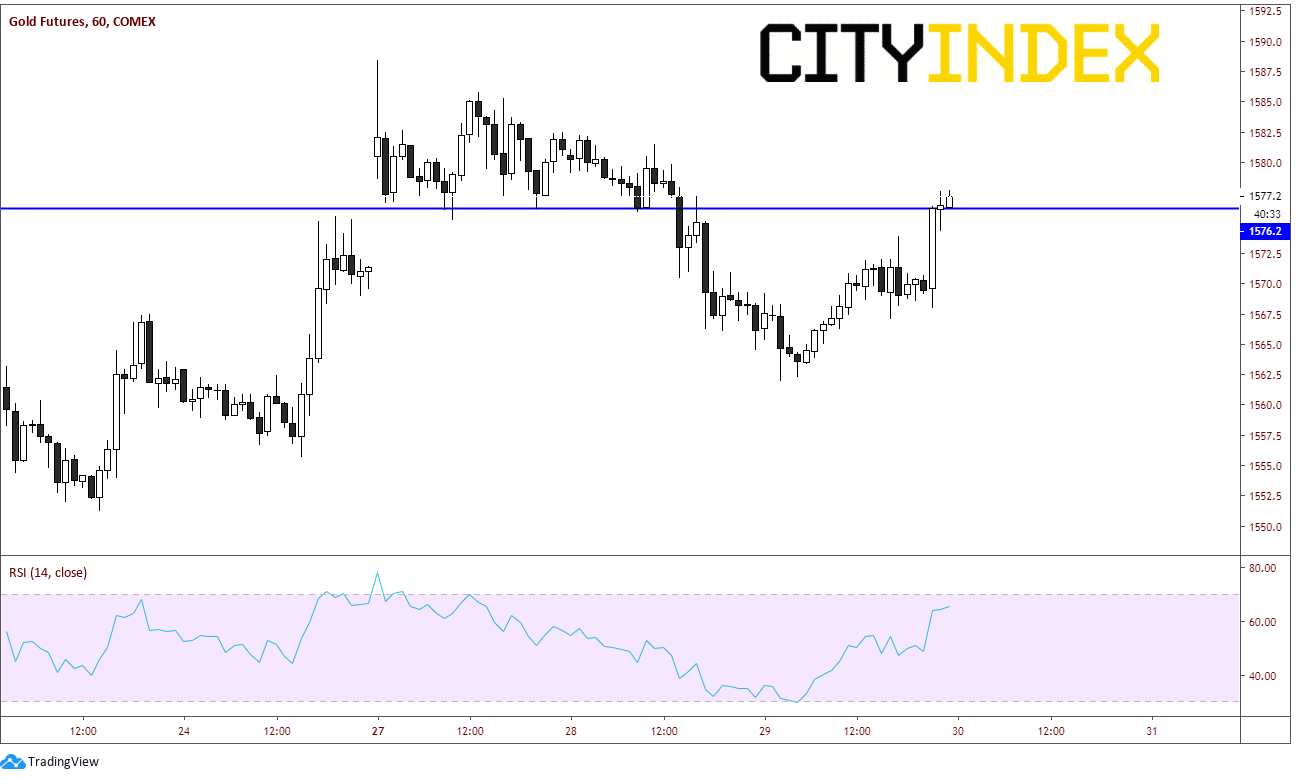
Or perhaps someone was just trying to push price higher through horizontal resistance, as seen on a 60-minute chart:
Source: Tradingview, COMEX, City Index
On a 240-minute chart, price is trying to break higher out of a symmetrical triangle. Perhaps someone was trying to push it through the upper trendline.
Source: Tradingview, COMEX, City Index
Does the Gold market know something other markets don’t? Whatever the reason for gold moving higher on the release of the FOMC statement today, it still looks like it’s trying to head towards the 1723 level! Price normally doesn’t move in a straight line, so expect some pullbacks along the way if it does continue higher!
The FOMC left rates unchanged today, targeting the 1.5%-1.75% range, as expected. The only small change the Fed made was to raise the IOER rate by 0.05% and announced that they would be extending repo operations until April. Otherwise, the statement and the press conference were….boring (for lack of a better word). However, as soon as the statement was released, gold began to go bid:
Source: Tradingview, COMEX, FOREX.com
Perhaps it was just back to business as usual. Below is the base chart I’ve been using for Gold. It’s the daily futures chart, which has broken out of a flag pattern and is currently on its way to target near 1723. Price had paused along the way and the RSI moved to extreme overbought territory (above 80). They slight pullback gave the RSI room to unwind back into neutral territory.
Source: Tradingview, COMEX, FOREX.com
Maybe someone knew early that Google was going to announce that they temporarily going to close all office in China due to the Coronavirus (source: Verge).
Or perhaps someone was just trying to push price higher through horizontal resistance, as seen on a 60-minute chart:
Source: Tradingview, COMEX, FOREX.com
On a 240-minute chart, price is trying to break higher out of a symmetrical triangle. Perhaps someone was trying to push it through the upper trendline.
Source: Tradingview, COMEX, FOREX.com
Does the Gold market know something other markets don’t? Whatever the reason for gold moving higher on the release of the FOMC statement today, it still looks like it’s trying to head towards the 1723 level! Price normally doesn’t move in a straight line, so expect some pullbacks along the way if it does continue higher!
Related tags:


The complete CFD trading experience
Award-winning platforms, competitive spreads, low commissions and dedicated support.
We live and breathe the markets and are dedicated to helping traders realise their ambitions as we continue to set the industry bar.
Economic calendar
Web Trader platform
Our sophisticated web-based platform is packed with features.
Related articles

Treasury Yields Lose Momentum as Energy ETF Retreats
The 10-year Treasury yield is testing a resistance zone respected since the 1920s, as bearish RSI divergence signals fading upside momentum.


NZD/USD pressure mounts as payrolls looms large
NZD/USD has fallen sharply as Fed rate expectations reset higher, but extreme downside stretch and major support raise the risk of a violent counter-trend rebound.


Gold Forecast: Are Bears Regaining Control of XAU/USD?
The start of the trading week has not been particularly favorable for gold. This can be seen in recent XAU/USD price action, with the metal falling nearly 4.00% over the last two trading sessions and bringing renewed attention to a bearish bias within the market.

StoneX Europe Ltd may make third party material available on this website which may contain information included but not limited to the conditions of financial markets. The material is for information purposes only and does not contain, and should not be construed as containing, investment advice and/or investment recommendation and/or an investment research and/or an offer of or solicitation for any transactions in financial instruments; any decision to enter into a specific transaction shall be made by the client following an assessment by him/her of their situation.
StoneX Europe Ltd makes no representation or warranty and assumes no liability as to the accuracy or completeness of the information provided, nor any loss arising from any investment based on a recommendation, forecast or other information supplied. You should always seek independent advice as to your suitability to speculate in any related markets and your ability to assume the associated risks, if you are at all unsure. We are not under any obligation to update any such material. Any opinion made may be personal to the author and may not reflect the opinion of StoneX Europe Ltd.