






What to watch post FOMC
Traders will be watching for tweaks in the statement and ANY hints regarding timing of the tapering
Share this:

As on most FOMC days, the overnight sessions are quiet. And although not much is expected from today’s meeting, there may be one or two small changes in the statement or the press conference. Fed Chairman Powell has gone through great lengths to ensure that expectations are known that the Fed will assume highly accommodative monetary policy until we are past the pandemic. (See our complete FOMC Preview here). However, there are always instruments to keep an eye on just in case Powell decides to surprise the markets.
Everything you need to know about the Federal Reserve
Gold
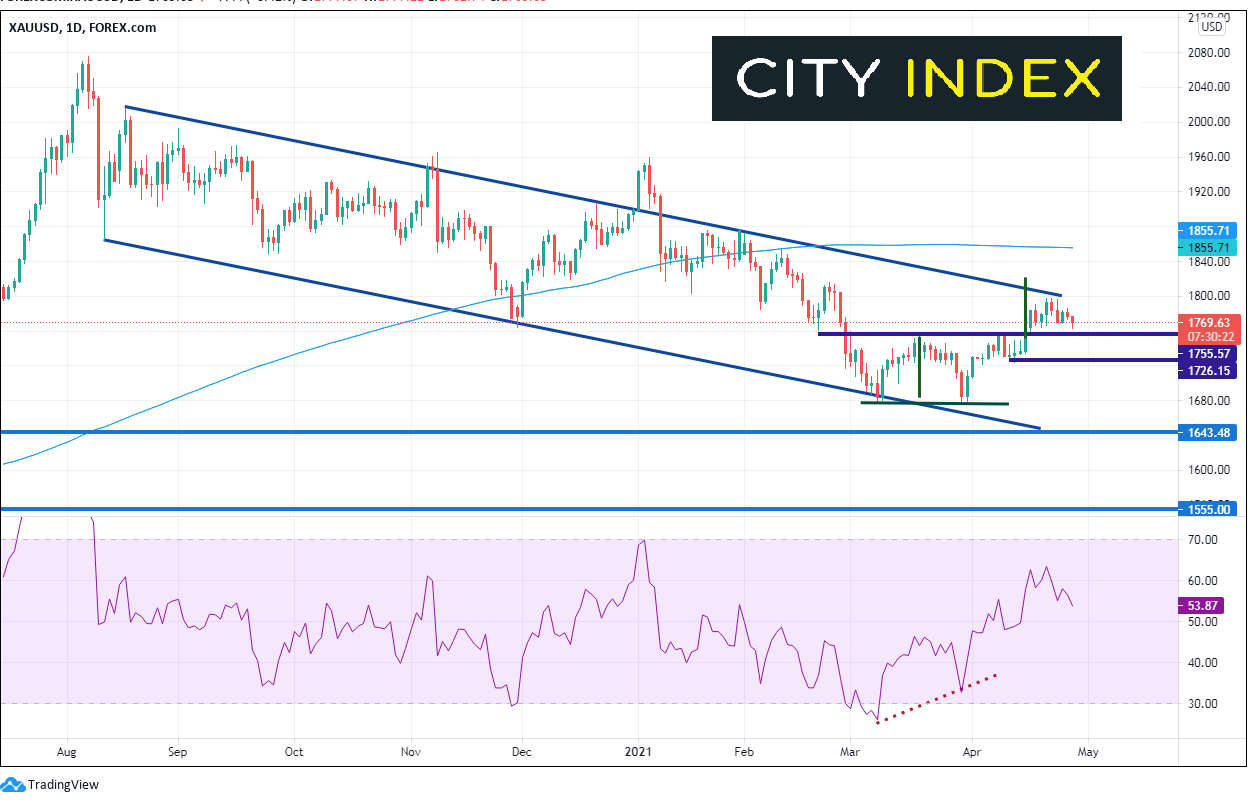
Gold (XAU/USD) had been moving lower in an orderly channel since August 2020. After reached the bottom trendline of the channel in early March, the precious metal tested the level once again near 1678 and formed a double bottom. After breaking the neckline on April 15th, the pair moved towards its double bottom target of 1830. However, last week, Gold ran into resistance at the top trendline of the channel near 1755.
Source: Tradingview, City Index
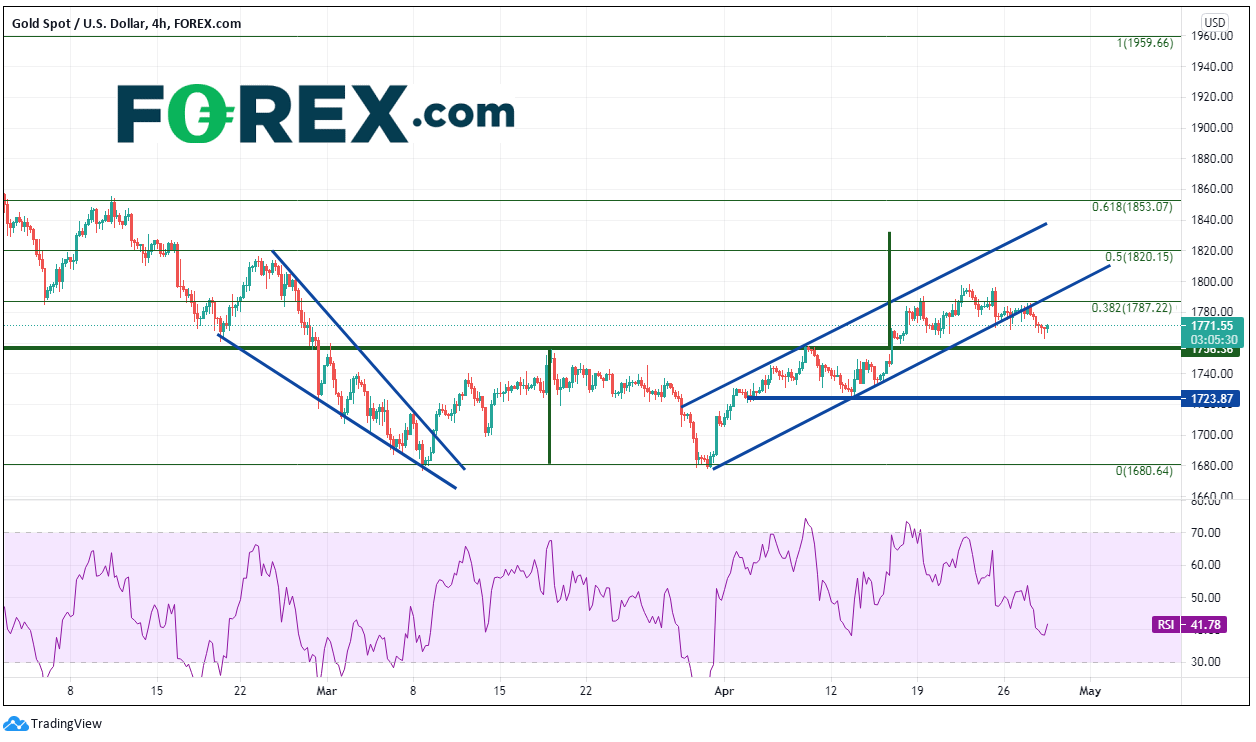
On a 240-minute timeframe, Gold moved higher within a channel to the 38.2% Fibonacci retracement level from the early January highs to the March double bottom lows, just below 1800. Currently, it has pulled back below the bottom trendline of the channel (most likely on profit taking ahead of the Fed). Support is at the neckline breakout of the double bottom near 1755, then horizontal support near 1724 ahead of the double bottom lows at 1722. Resistance above is at the confluence of the previous highs and the trendline near 1798 and then the 50% retracement level from the previously mentioned timeframe near 1820.
Source: Tradingview, City Index
Learn How to start gold trading
US 10-Year Yields
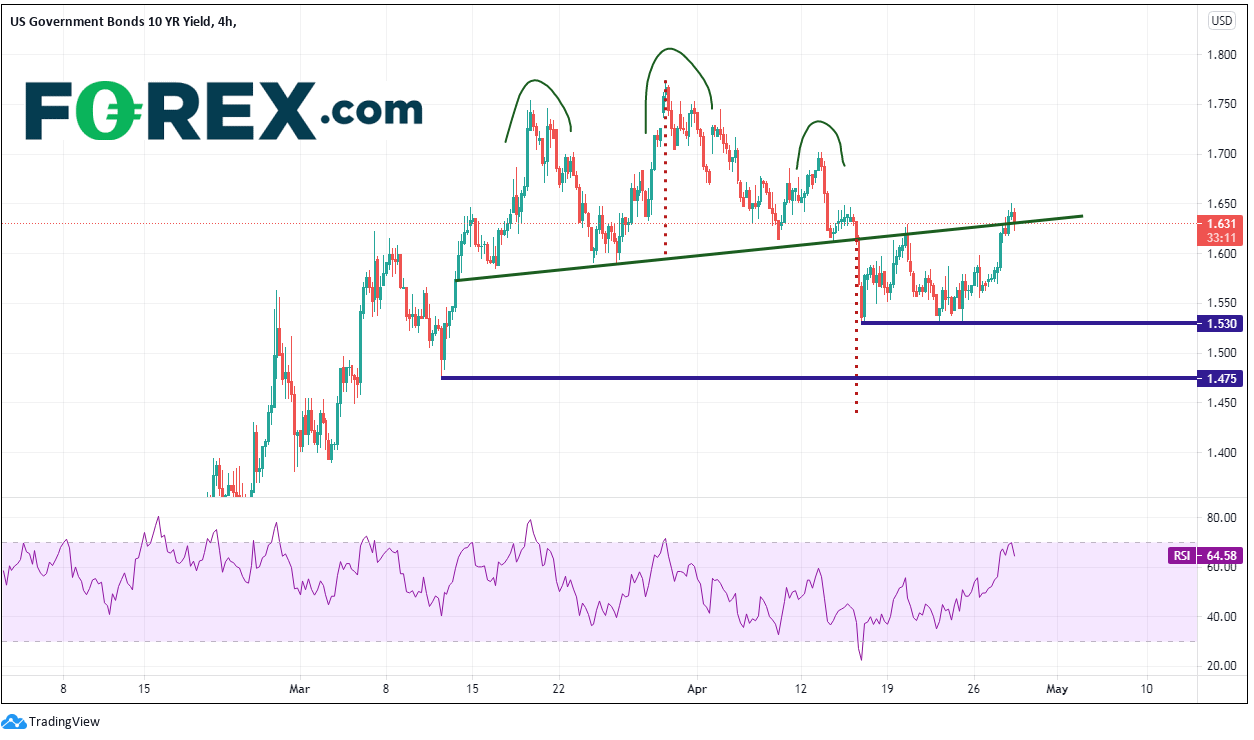
Yields could also move post-FOMC. 10-year yields had recently formed a head a shoulders pattern and have come back to test the neckline for a second time, as well as horizontal resistance from the right shoulder is near 1.65. Any hawkish speak from the FOMC statement or Powell in the press conference could cause a clear break above the neckline and cause a failure of the pattern. Resistance is at the right shoulder highs near 1.70 and then the top of the head near 1.762. Support below is at the recent lows of 1.53, followed by the March 11th lows of 1.475. The target for the head and shoulders pattern is below there at 1.435.
Source: Tradingview, City Index
DXY
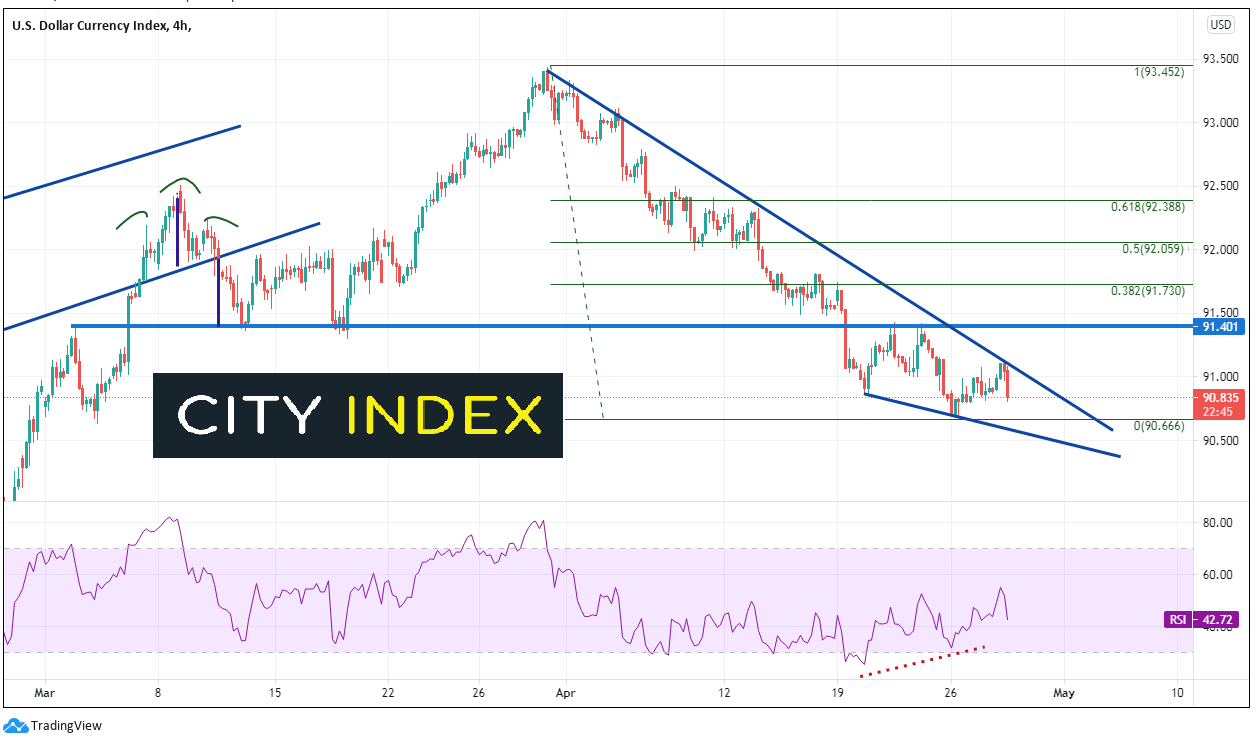
Of course, the US Dollar is always important to watch when looking at interest rates. The US Dollar Index (DXY) has been moving lower since putting in quarter end and month end highs on March 31st. Could this be the moment the index reverses and continues moving higher? On a 240-minute timeframe the DXY has formed a descending wedge and is nearing the apex. Any hawkish talk from the Fed could send the index higher. Resistance is at the overnight highs and the top downward sloping trendline of the wedge near 91.10. Above there is recent highs and horizontal resistance near 91.40 and then the 38.2% Fibonacci retracement level from the March 31st highs to the April 26th lows near 91.73. Support is at the April 26th lows near 90.66, then the bottom trendline of the wedge near 90.55. The psychological round number support is at 90.00.
Source: Tradingview, City Index
Expectations are for an unchanged FOMC. Traders will be watching for tweaks in the statement and ANY hints regarding timing of the tapering at the press conference. Be alert for any surprises and note inflection points BEFORE the meeting!
Learn more about forex trading opportunities.
As on most FOMC days, the overnight sessions are quiet. And although not much is expected from today’s meeting, there may be one or two small changes in the statement or the press conference. Fed Chairman Powell has gone through great lengths to ensure that expectations are known that the Fed will assume highly accommodative monetary policy until we are past the pandemic. (See our complete FOMC Preview here). However, there are always instruments to keep an eye on just in case Powell decides to surprise the markets.
Gold
Gold (XAU/USD) had been moving lower in an orderly channel since August 2020. After reached the bottom trendline of the channel in early March, the precious metal tested the level once again near 1678 and formed a double bottom. After breaking the neckline on April 15th, the pair moved towards its double bottom target of 1830. However, last week, Gold ran into resistance at the top trendline of the channel near 1755.
Source: Tradingview, FOREX.com
On a 240-minute timeframe, Gold moved higher within a channel to the 38.2% Fibonacci retracement level from the early January highs to the March double bottom lows, just below 1800. Currently, it has pulled back below the bottom trendline of the channel (most likely on profit taking ahead of the Fed). Support is at the neckline breakout of the double bottom near 1755, then horizontal support near 1724 ahead of the double bottom lows at 1722. Resistance above is at the confluence of the previous highs and the trendline near 1798 and then the 50% retracement level from the previously mentioned timeframe near 1820.
Source: Tradingview, FOREX.com
Learn How to start gold trading
US 10-Year Yields
Yields could also move post-FOMC. 10-year yields had recently formed a head a shoulders pattern and have come back to test the neckline for a second time, as well as horizontal resistance from the right shoulder is near 1.65. Any hawkish speak from the FOMC statement or Powell in the press conference could cause a clear break above the neckline and cause a failure of the pattern. Resistance is at the right shoulder highs near 1.70 and then the top of the head near 1.762. Support below is at the recent lows of 1.53, followed by the March 11th lows of 1.475. The target for the head and shoulders pattern is below there at 1.435.
Source: Tradingview, FOREX.com
DXY
Of course, the US Dollar is always important to watch when looking at interest rates. The US Dollar Index (DXY) has been moving lower since putting in quarter end and month end highs on March 31st. Could this be the moment the index reverses and continues moving higher? On a 240-minute timeframe the DXY has formed a descending wedge and is nearing the apex. Any hawkish talk from the Fed could send the index higher. Resistance is at the overnight highs and the top downward sloping trendline of the wedge near 91.10. Above there is recent highs and horizontal resistance near 91.40 and then the 38.2% Fibonacci retracement level from the March 31st highs to the April 26th lows near 91.73. Support is at the April 26th lows near 90.66, then the bottom trendline of the wedge near 90.55. The psychological round number support is at 90.00.
Source: Tradingview, FOREX.com
Expectations are for an unchanged FOMC. Traders will be watching for tweaks in the statement and ANY hints regarding timing of the tapering at the press conference. Be alert for any surprises and note inflection points BEFORE the meeting!
Related tags:
Latest market news




The complete CFD trading experience
Award-winning platforms, competitive spreads, low commissions and dedicated support.
We live and breathe the markets and are dedicated to helping traders realise their ambitions as we continue to set the industry bar.
Economic calendar
Web Trader platform
Our sophisticated web-based platform is packed with features.
Related articles
USD/JPY Q4 2026 Outlook: Hawkish Fed Pricing Clashes With Intervention Risk
The year-end tug-of-war is clear: hawkish Fed pricing supports USD/JPY, while intervention risk limits the upside.


Japanese Yen Forecast: USD/JPY 4% Rally Challenges Post-Intervention Downtrend 9 24 2026
USD/JPY momentum has shifted sharply higher, putting a major resistance confluence in focus as U.S. and Japanese event risk builds.


Oil Quietly Hands the Fed a Reason to Stay Hawkish
Oil prices and the U.S. dollar are both on the front foot as elevated energy costs feed Fed warnings that inflation may prove sticky.

StoneX Europe Ltd may make third party material available on this website which may contain information included but not limited to the conditions of financial markets. The material is for information purposes only and does not contain, and should not be construed as containing, investment advice and/or investment recommendation and/or an investment research and/or an offer of or solicitation for any transactions in financial instruments; any decision to enter into a specific transaction shall be made by the client following an assessment by him/her of their situation.
StoneX Europe Ltd makes no representation or warranty and assumes no liability as to the accuracy or completeness of the information provided, nor any loss arising from any investment based on a recommendation, forecast or other information supplied. You should always seek independent advice as to your suitability to speculate in any related markets and your ability to assume the associated risks, if you are at all unsure. We are not under any obligation to update any such material. Any opinion made may be personal to the author and may not reflect the opinion of StoneX Europe Ltd.