



WTI Crude Oil How far can it go
As history tends to repeat itself, while the rebound in oil prices was staggering, we might have to avoid being over optimistic...
Share this:

Thanks to the latest OPEC+ oil cut, oil prices have recouped most of its losses during the selloff started in March.
In early May, we mentioned that history tends to repeat itself and the same may happen soon. While the rebound in oil prices was staggering, we might have to avoid being over optimistic.

Source: Trading View, Gain Capital (WTI Crude Oil Futures monthly chart)
WTI Crude Oil price has been trending lower since 2008, given the rise of clean energy and the U.S. shale oil boom. It is worth noticing that the previous OPEC+ oil production cut had led to a roughly 60% rebound in WTI oil price, but failed to change the down trend, as the prices recovery led to higher output again. This time after a remarkable bounce back, the remaining upside potential for WTI oil price could be limited.

Source: Trading View, Gain Capital (WTI Crude Oil Futures weekly chart)
Nevertheless, WTI Crude Oil Futures stay on the upside as shown on the weekly chart after posting a V-shaped rebound. However, it has to break above its nearest resistance level at $44.00, which is the bottom of its previous trading range in 2017 to 2019, to open a path to the next resistance at $48.90. Alternatively, losing the nearest support at $34.00 would suggest that the next support at $29.80 might be exposed.
Thanks to the latest OPEC+ oil cut, oil prices have recouped most of its losses during the selloff started in March.
In early May, we mentioned that history tends to repeat itself and the same may happen soon. While the rebound in oil prices was staggering, we might have to avoid being over optimistic.
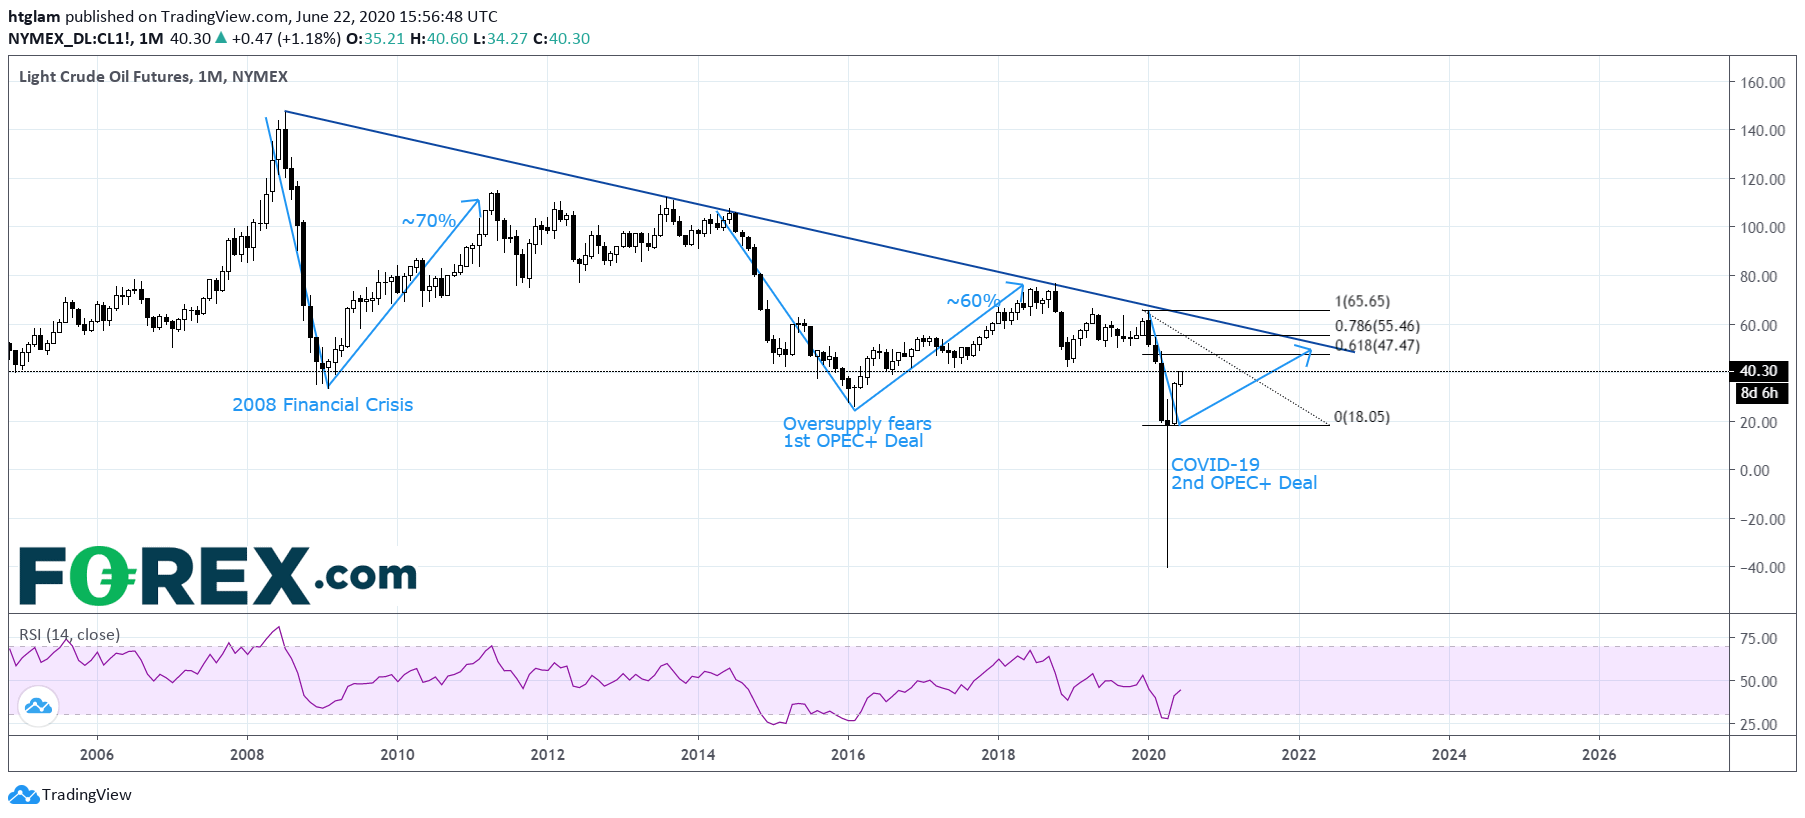
Source: Trading View, Gain Capital (WTI Crude Oil Futures monthly chart)
WTI Crude Oil price has been trending lower since 2008, given the rise of clean energy and the U.S. shale oil boom. It is worth noticing that the previous OPEC+ oil production cut had led to a roughly 60% rebound in WTI oil price, but failed to change the down trend, as the prices recovery led to higher output again. This time after a remarkable bounce back, the remaining upside potential for WTI oil price could be limited.
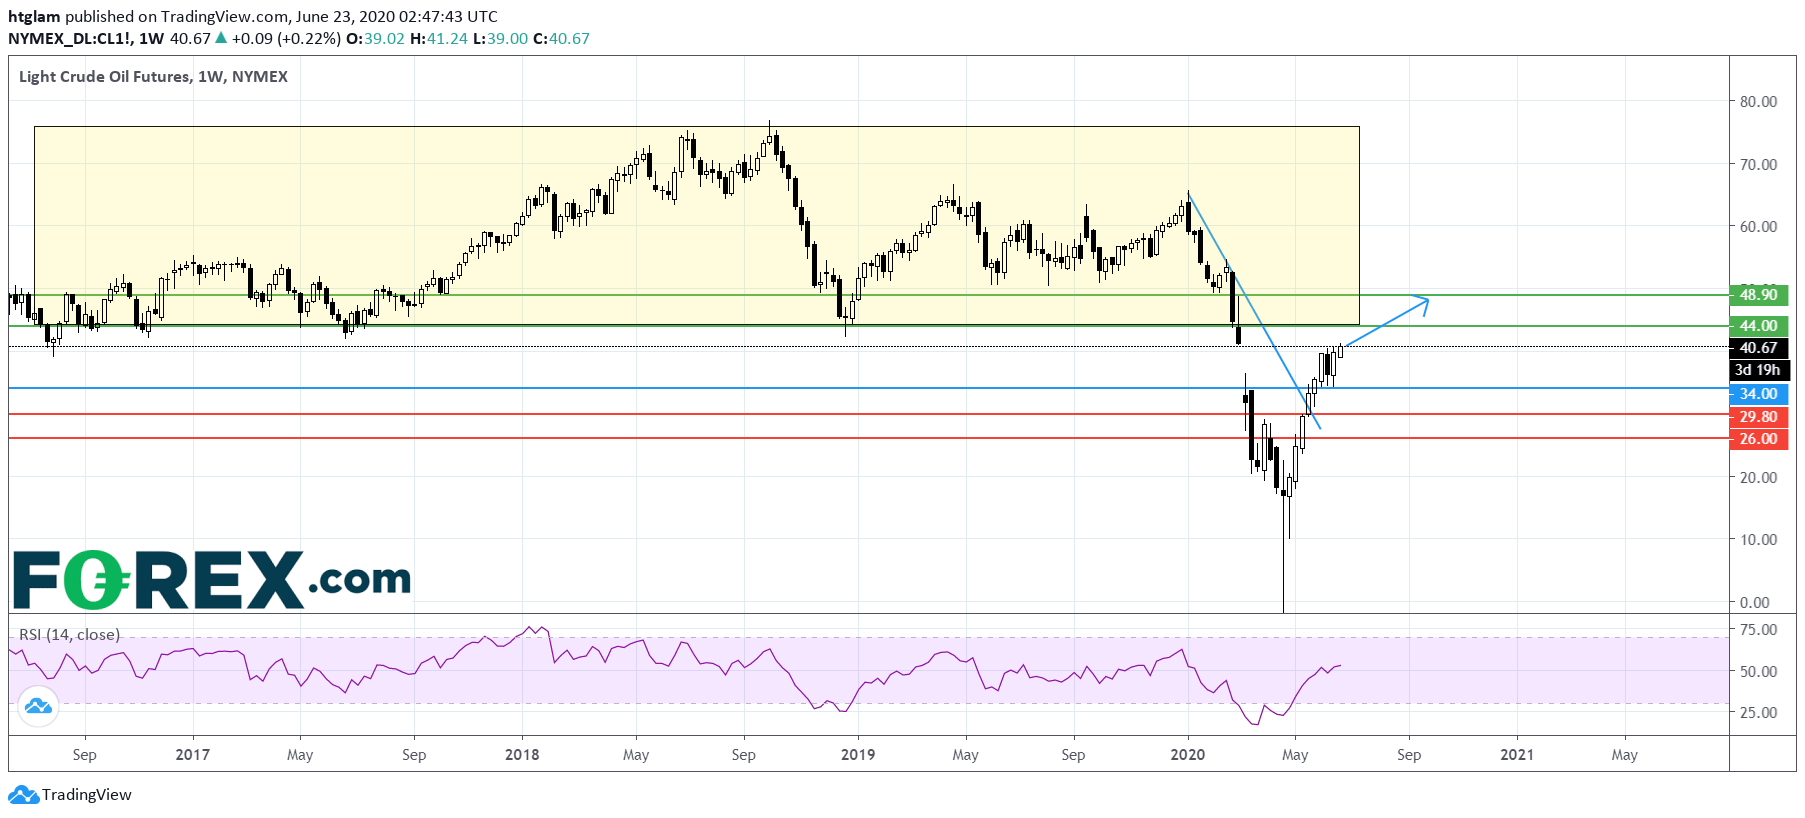
Source: Trading View, Gain Capital (WTI Crude Oil Futures weekly chart)
Nevertheless, WTI Crude Oil Futures stay on the upside as shown on the weekly chart after posting a V-shaped rebound. However, it has to break above its nearest resistance level at $44.00, which is the bottom of its previous trading range in 2017 to 2019, to open a path to the next resistance at $48.90. Alternatively, losing the nearest support at $34.00 would suggest that the next support at $29.80 might be exposed.
Related tags:




The complete CFD trading experience
Award-winning platforms, competitive spreads, low commissions and dedicated support.
We live and breathe the markets and are dedicated to helping traders realise their ambitions as we continue to set the industry bar.
Economic calendar
Web Trader platform
Our sophisticated web-based platform is packed with features.
Related articles

EUR/USD, USD/JPY Outlook: Oil, yields and an FX identity crisis
Crude oil is setting the tone across rates and FX, leaving EUR/USD vulnerable and USD/JPY caught between higher Treasury yields and the growing threat of intervention


Nasdaq 100 Forecast: NDX falls as oil jumps and Treasury yields rise
U.S. stocks are pointing to a weaker open on Monday after President Trump rejected an Iranian ceasefire, sending oil prices higher and fuelling inflationary concerns and pushing Treasury yields higher.


Crude Oil Q4 2026 Outlook: Will a New Energy-Security Regime Emerge?
Crude Oil Q4 2026 Outlook: The U.S.-Iran conflict has done more than disrupt oil flows. It has challenged many of the assumptions underpinning the global energy security system established after the 1973 oil embargo.

StoneX Europe Ltd may make third party material available on this website which may contain information included but not limited to the conditions of financial markets. The material is for information purposes only and does not contain, and should not be construed as containing, investment advice and/or investment recommendation and/or an investment research and/or an offer of or solicitation for any transactions in financial instruments; any decision to enter into a specific transaction shall be made by the client following an assessment by him/her of their situation.
StoneX Europe Ltd makes no representation or warranty and assumes no liability as to the accuracy or completeness of the information provided, nor any loss arising from any investment based on a recommendation, forecast or other information supplied. You should always seek independent advice as to your suitability to speculate in any related markets and your ability to assume the associated risks, if you are at all unsure. We are not under any obligation to update any such material. Any opinion made may be personal to the author and may not reflect the opinion of StoneX Europe Ltd.