



WTI Under Pressure, Gold Extends Gains
WTI crude remains under pressure near 62 as OPEC+ raises output and demand worries linger, while gold extends gains above 3,650 on safe-haven flows and Fed rate-cut bets. What are the next key levels?
Share this:

Key Events This Week
- Gold continues its bullish rally above 3,650, stalling broader market appetite.
- Crude oil holds above 61 despite OPEC’s modest production hike of 137,000 barrels per day starting in October.
- US CPI release (Thursday).
- US Preliminary Consumer Sentiment (Friday)
Gold’s bullish breakout from a 5-month triangle pattern continues to fuel gains, reinforced by growing political instability across the EU, UK, Japan, and the US. This safe-haven demand is amplified by a weaker dollar backdrop, with the US Dollar Index holding in a rangebound, bearish posture. Meanwhile, US equity indices remain cautious below record highs as investors await clearer signals on economic data and monetary policy. The release of Thursday’s CPI report could act as a catalyst, injecting another wave of volatility into the markets.
OPEC+ Policy: Gradual Unwinding of Output Cuts
At its September 2025 meeting, OPEC+ expressed optimism about cautiously regaining its market share and confirmed it will unwind only 137,000 barrels per day of voluntary cuts starting in October.
- This is part of the second tranche of a broader 1.6 million bpd unwinding, following the earlier 2.2 million bpd cuts that were fully reversed by September 2025.
- The decision reflects OPEC+’s strategy to regain market share after years of production restraint.
Oil Revenues vs. Market Share
Despite the measured pace of output increases, the current oil price zone (around $62–65 WTI) remains unfavorable for OPEC+ member revenues. This trade-off—between higher production and weaker prices—raises the likelihood of longer-term bullish positioning once the group completes the full unwinding cycle.
Gold vs. Oil Dynamics
As long as gold continues to rise, questions persist about global economic and monetary confidence. This in turn could dampen the demand outlook for crude oil unless sanctions or supply disruptions escalate.
On the other hand, renewed US-Russia deals, or sanction relief could weigh further on crude prices, leaving scope for another downward leg in oil while gold may still have room for one more upward push before any potential broad market recovery.
Technical Analysis: Quantifying Uncertainty
Crude Oil Outlook: Daily Time Frame – Log Scale
Source: Tradingview
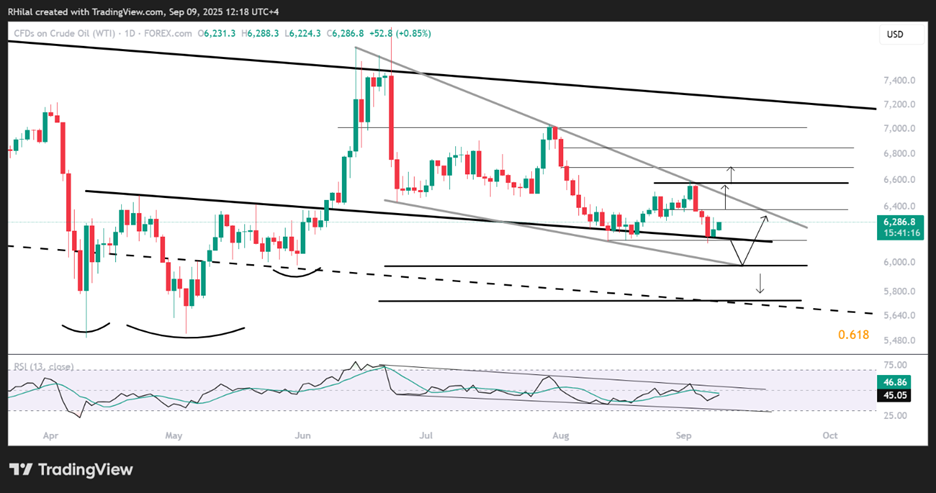
WTI has remained in a downward contraction pattern since June 2025, forming a sequence of lower highs and lower lows. This price action suggests the potential for a fifth leg lower toward the base of the formation before a possible rebound.
Support:
61.30 – still holding as the key support.
A clean break below could extend losses to 59.80, setting up a potential bullish rebound.
A deeper decline risks moving back toward 55.00.
Resistance:
A rebound above 65.80 and a confirmed breakout from the triangle pattern could open the way toward 67.00, then 68.50, and 70.00 respectively.
Gold Outlook: daily time frame – log scale
Source: Tradingview
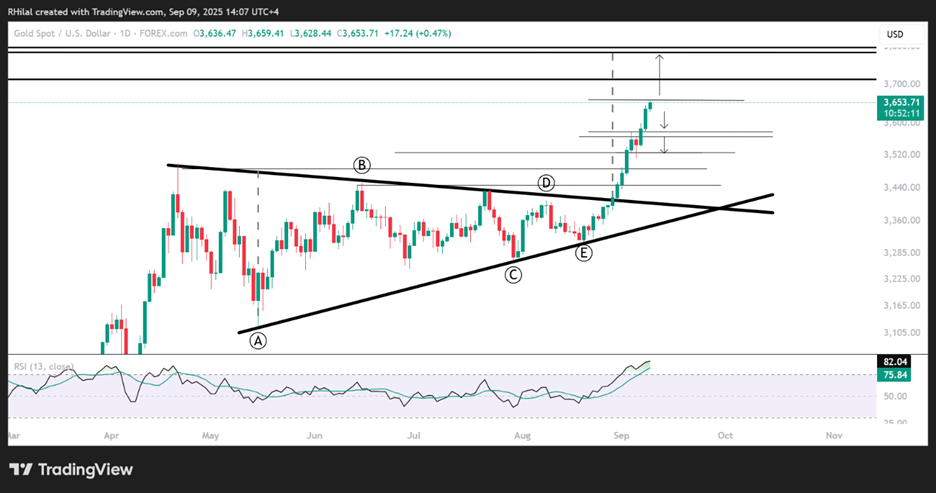
Gold’s bullish breakout targets the full 5-month triangle potential at 3,780, though resistance levels and pullback risks remain in focus.
- Support: Failure to close above 3,660 could trigger pullbacks toward 3,580 and 3,520 for a potential continuation setup. A deeper decline below 3,520 could extend losses toward the consolidation border at 3,480 and 3,450 respectively.
- Resistance: A firm close above 3,660 may extend gains toward 3,710, then 3,780 (major resistance), and eventually the 4,000 mark.
Written by Razan Hilal, CMT
Follow on X: @Rh_waves
Related tags:


The complete CFD trading experience
Award-winning platforms, competitive spreads, low commissions and dedicated support.
We live and breathe the markets and are dedicated to helping traders realise their ambitions as we continue to set the industry bar.
Economic calendar
Web Trader platform
Our sophisticated web-based platform is packed with features.
Related articles

Treasury Yields Lose Momentum as Energy ETF Retreats
The 10-year Treasury yield is testing a resistance zone respected since the 1920s, as bearish RSI divergence signals fading upside momentum.

GBP/USD, Oil Forecast: Two trades to watch 300926
GBP/USD: Can Stronger UK Growth Offset the Dollar’s Advantage? Oil: Supply Recovery Challenges the Geopolitical Premium.


Gold Forecast: Are Bears Regaining Control of XAU/USD?
The start of the trading week has not been particularly favorable for gold. This can be seen in recent XAU/USD price action, with the metal falling nearly 4.00% over the last two trading sessions and bringing renewed attention to a bearish bias within the market.

StoneX Europe Ltd may make third party material available on this website which may contain information included but not limited to the conditions of financial markets. The material is for information purposes only and does not contain, and should not be construed as containing, investment advice and/or investment recommendation and/or an investment research and/or an offer of or solicitation for any transactions in financial instruments; any decision to enter into a specific transaction shall be made by the client following an assessment by him/her of their situation.
StoneX Europe Ltd makes no representation or warranty and assumes no liability as to the accuracy or completeness of the information provided, nor any loss arising from any investment based on a recommendation, forecast or other information supplied. You should always seek independent advice as to your suitability to speculate in any related markets and your ability to assume the associated risks, if you are at all unsure. We are not under any obligation to update any such material. Any opinion made may be personal to the author and may not reflect the opinion of StoneX Europe Ltd.