



Apple joins other large tech firms and will slow recruitment in 2023
Can Apple's share price continue lower? If price breaks below the ascending wedge, the target is near 134.07!
Share this:

Like many of its peers, Apple (AAPL) has announced that will be cutting back on hiring due to tough global macroeconomic conditions. Microsoft, Google and Meta (formerly Facebook) have already announced similar measures to slow their hiring process due to a potential looming slowdown in economic activity. Apple is expected to release a new iPhone 14, as well as its new MR headset in January. Apple will release Q3 earnings on July 28th. Expectations are that revenues will rise to $82.6 billion and EPS will fall over 11% to $1.15. See out Big Tech earnings preview here.
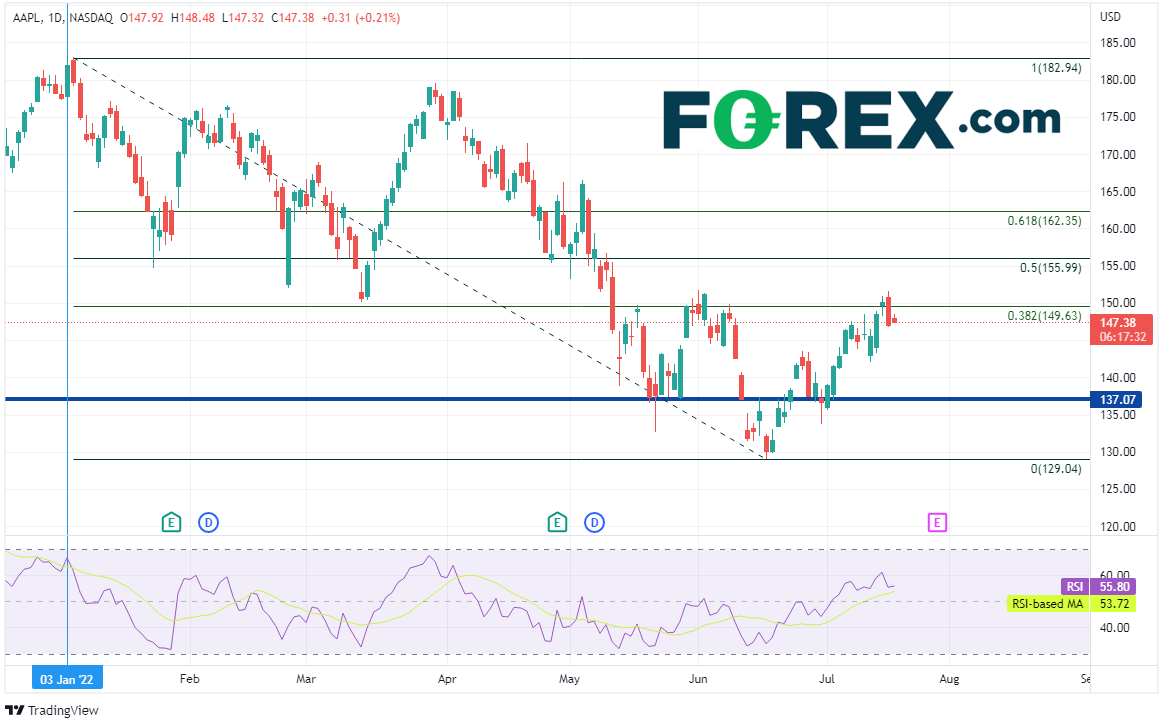
Since the beginning of 2022, AAPL shares have fallen from a high on January 4th at 182.94 to a low on June 16th at 129.04. Apple then bounced to the 38.2% Fibonacci retracement level from the same timeframe near 149.63 on July 15th. Yesterday, after the slowdown in hiring was announced, the large tech stock sold off 2.06% on the day and formed a bearish engulfing candlestick on the daily timeframe. This is a one candle reversal pattern, indicating that there may be more downside for the stock.
Source: Tradingview, Stone X
Trade AAPL now: Login or open a new account!
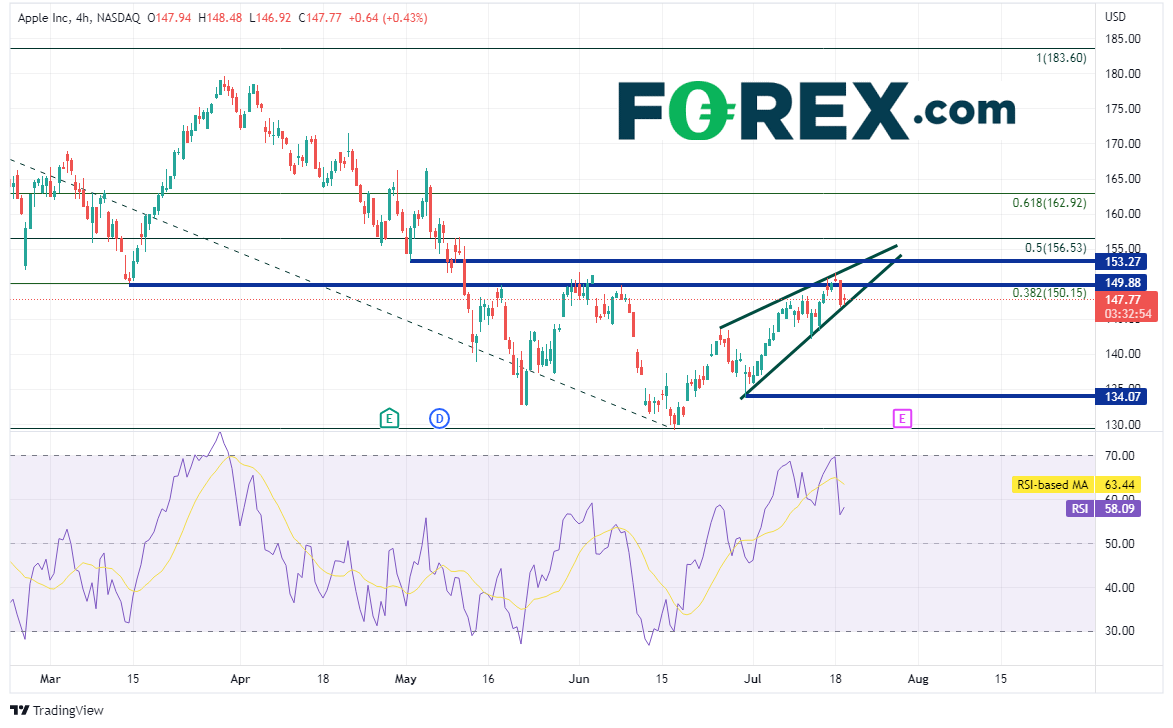
On a 240-minute timeframe, AAPL bounced from the lows of July 15th in an ascending wedge formation. Expectations are that price will break lower from an ascending wedge. The target for the retracement of the breakdown of an ascending wedge is a 100% retracement, or near 134.07. First support is the bottom trendline of the wedge, near 146.73. If price breaks below there, it can drop to the target lows at 134.07 and then the lows from June 16th at 129.47. If price moves higher, first resistance is at yesterday’s high and the top trendline of the wedge, near 151.57. Above there, price can move to horizontal resistance at 153.27, just ahead of the 50% retracement level from the January 4th highs to the June 16th lows at 156.53.
Source: Tradingview, Stone X
Apple announced yesterday that it would be cutting back on its hiring plans in 2023, following in the steps of other tech giants. Apple’s share price took a hit. Can it continue lower? If price breaks below the ascending wedge, the target is near 134.07!
Learn more about equity trading opportunities.
Like many of its peers, Apple (AAPL) has announced that will be cutting back on hiring due to tough global macroeconomic conditions. Microsoft, Google and Meta (formerly Facebook) have already announced similar measures to slow their hiring process due to a potential looming slowdown in economic activity. Apple is expected to release a new iPhone 14, as well as its new MR headset in January. Apple will release Q3 earnings on July 28th. Expectations are that revenues will rise to $82.6 billion and EPS will fall over 11% to $1.15. See out Big Tech earnings preview here.
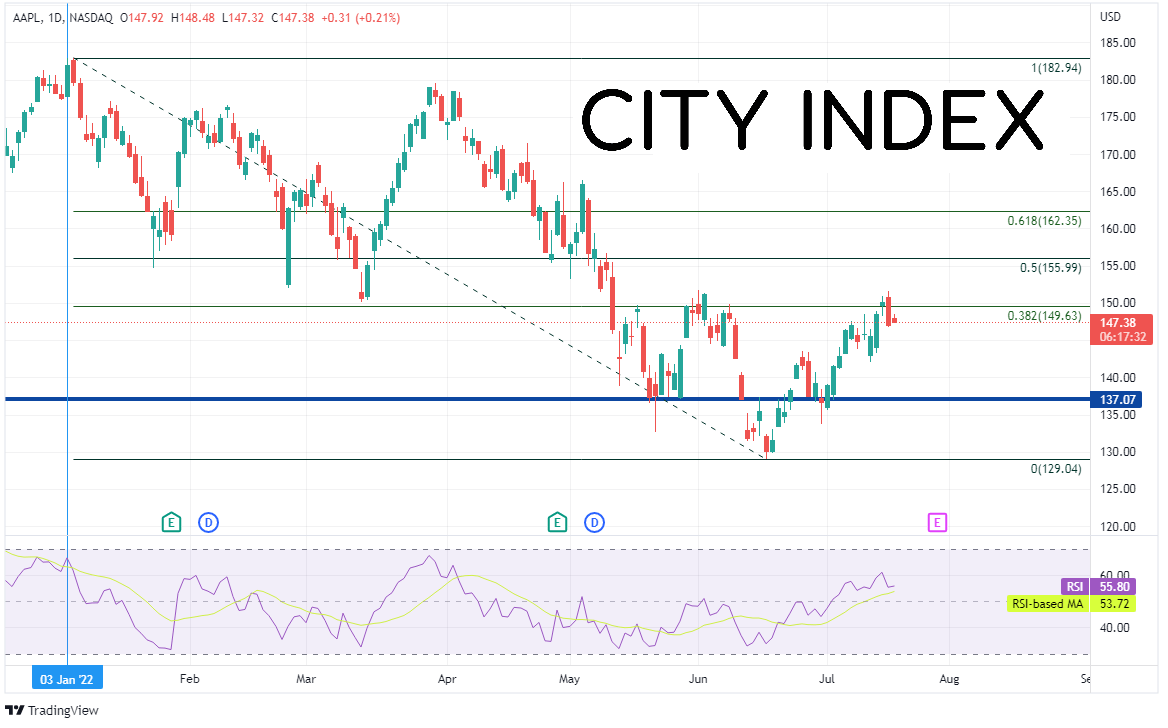
Since the beginning of 2022, AAPL shares have fallen from a high on January 4th at 182.94 to a low on June 16th at 129.04. Apple then bounced to the 38.2% Fibonacci retracement level from the same timeframe near 149.63 on July 15th. Yesterday, after the slowdown in hiring was announced, the large tech stock sold off 2.06% on the day and formed a bearish engulfing candlestick on the daily timeframe. This is a one candle reversal pattern, indicating that there may be more downside for the stock.
Source: Tradingview, Stone X
Trade AAPL now: Login or Open a new account!
• Open an account in the UK
• Open an account in Australia
• Open an account in Singapore
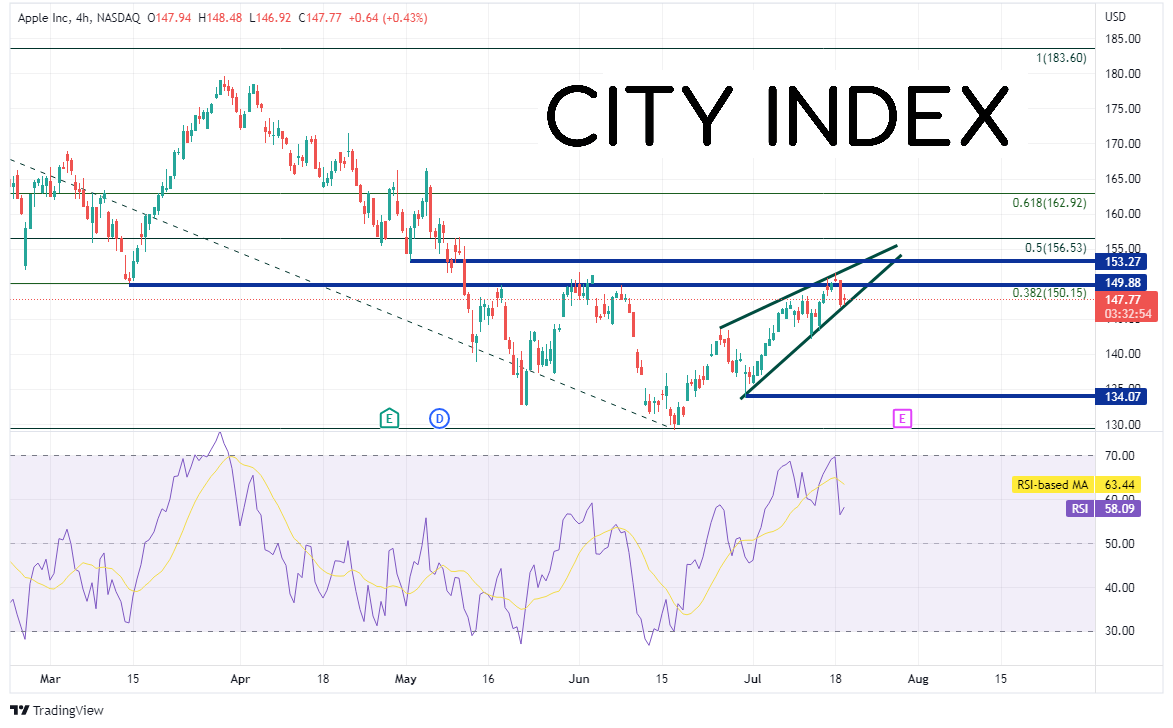
On a 240-minute timeframe, AAPL bounced from the lows of July 15th in an ascending wedge formation. Expectations are that price will break lower from an ascending wedge. The target for the retracement of the breakdown of an ascending wedge is a 100% retracement, or near 134.07. First support is the bottom trendline of the wedge, near 146.73. If price breaks below there, it can drop to the target lows at 134.07 and then the lows from June 16th at 129.47. If price moves higher, first resistance is at yesterday’s high and the top trendline of the wedge, near 151.57. Above there, price can move to horizontal resistance at 153.27, just ahead of the 50% retracement level from the January 4th highs to the June 16th lows at 156.53.
Source: Tradingview, Stone X
Apple announced yesterday that it would be cutting back on its hiring plans in 2023, following in the steps of other tech giants. Apple’s share price took a hit. Can it continue lower? If price breaks below the ascending wedge, the target is near 134.07!
Learn more about equity trading opportunities.
Related tags:

Open an account in minutes
Experience award-winning platforms with fast and secure execution.
Economic calendar
Web Trader platform
Our sophisticated web-based platform is packed with features.
Related articles

Nasdaq 100 Outlook: Slingshot rally or false dawn?
Nasdaq 100 futures are threatening to reclaim the 200-day moving average following their largest initial breakdown in more than 26 years. History suggests getting back above it is one thing, staying there another.


USD/JPY, USD/CAD Outlook: Fed hawks put dollar bulls on alert
Hotter US inflation and hawkish Fed commentary have triggered a sharp repricing of interest rate expectations. USD/JPY and USD/CAD are in focus as the dollar's sensitivity to Fed policy strengthens.

Gold Feels the Weight of USD, Yields on Hawkish Fed and CPI
Gold remains under pressure as hot US CPI, rising Treasury yields and hawkish Fed commentary support the US dollar. Bears eye another break below $4,000
The information on this web site is not targeted at the general public of any particular country. It is not intended for distribution to residents in any country where such distribution or use would contravene any local law or regulatory requirement. The information and opinions in this report are for general information use only and are not intended as an offer or solicitation with respect to the purchase or sale of any currency or CFD contract. All opinions and information contained in this report are subject to change without notice. This report has been prepared without regard to the specific investment objectives, financial situation and needs of any particular recipient. Any references to historical price movements or levels is informational based on our analysis and we do not represent or warranty that any such movements or levels are likely to reoccur in the future. While the information contained herein was obtained from sources believed to be reliable, author does not guarantee its accuracy or completeness, nor does author assume any liability for any direct, indirect or consequential loss that may result from the reliance by any person upon any such information or opinions.
Futures, Options on Futures, Foreign Exchange and other leveraged products involves significant risk of loss and is not suitable for all investors. Losses can exceed your deposits. Increasing leverage increases risk. Spot Gold and Silver contracts are not subject to regulation under the U.S. Commodity Exchange Act. Contracts for Difference (CFDs) are not available for US residents. Before deciding to trade forex, commodity futures, or digital assets, you should carefully consider your financial objectives, level of experience and risk appetite. Any opinions, news, research, analyses, prices or other information contained herein is intended as general information about the subject matter covered and is provided with the understanding that we do not provide any investment, legal, or tax advice. You should consult with appropriate counsel or other advisors on all investment, legal, or tax matters. References to FOREX.com or GAIN Capital refer to StoneX Group Inc. and its subsidiaries. Please read Characteristics and Risks of Standardized Options.