
What happened last week
The S&P 500 has managed to break above its former intermediate resistance at 1998 and staged a rally to a new historical all-time high at 2019 as expected. Please click on this link for our previous weekly write-up.
Key elements
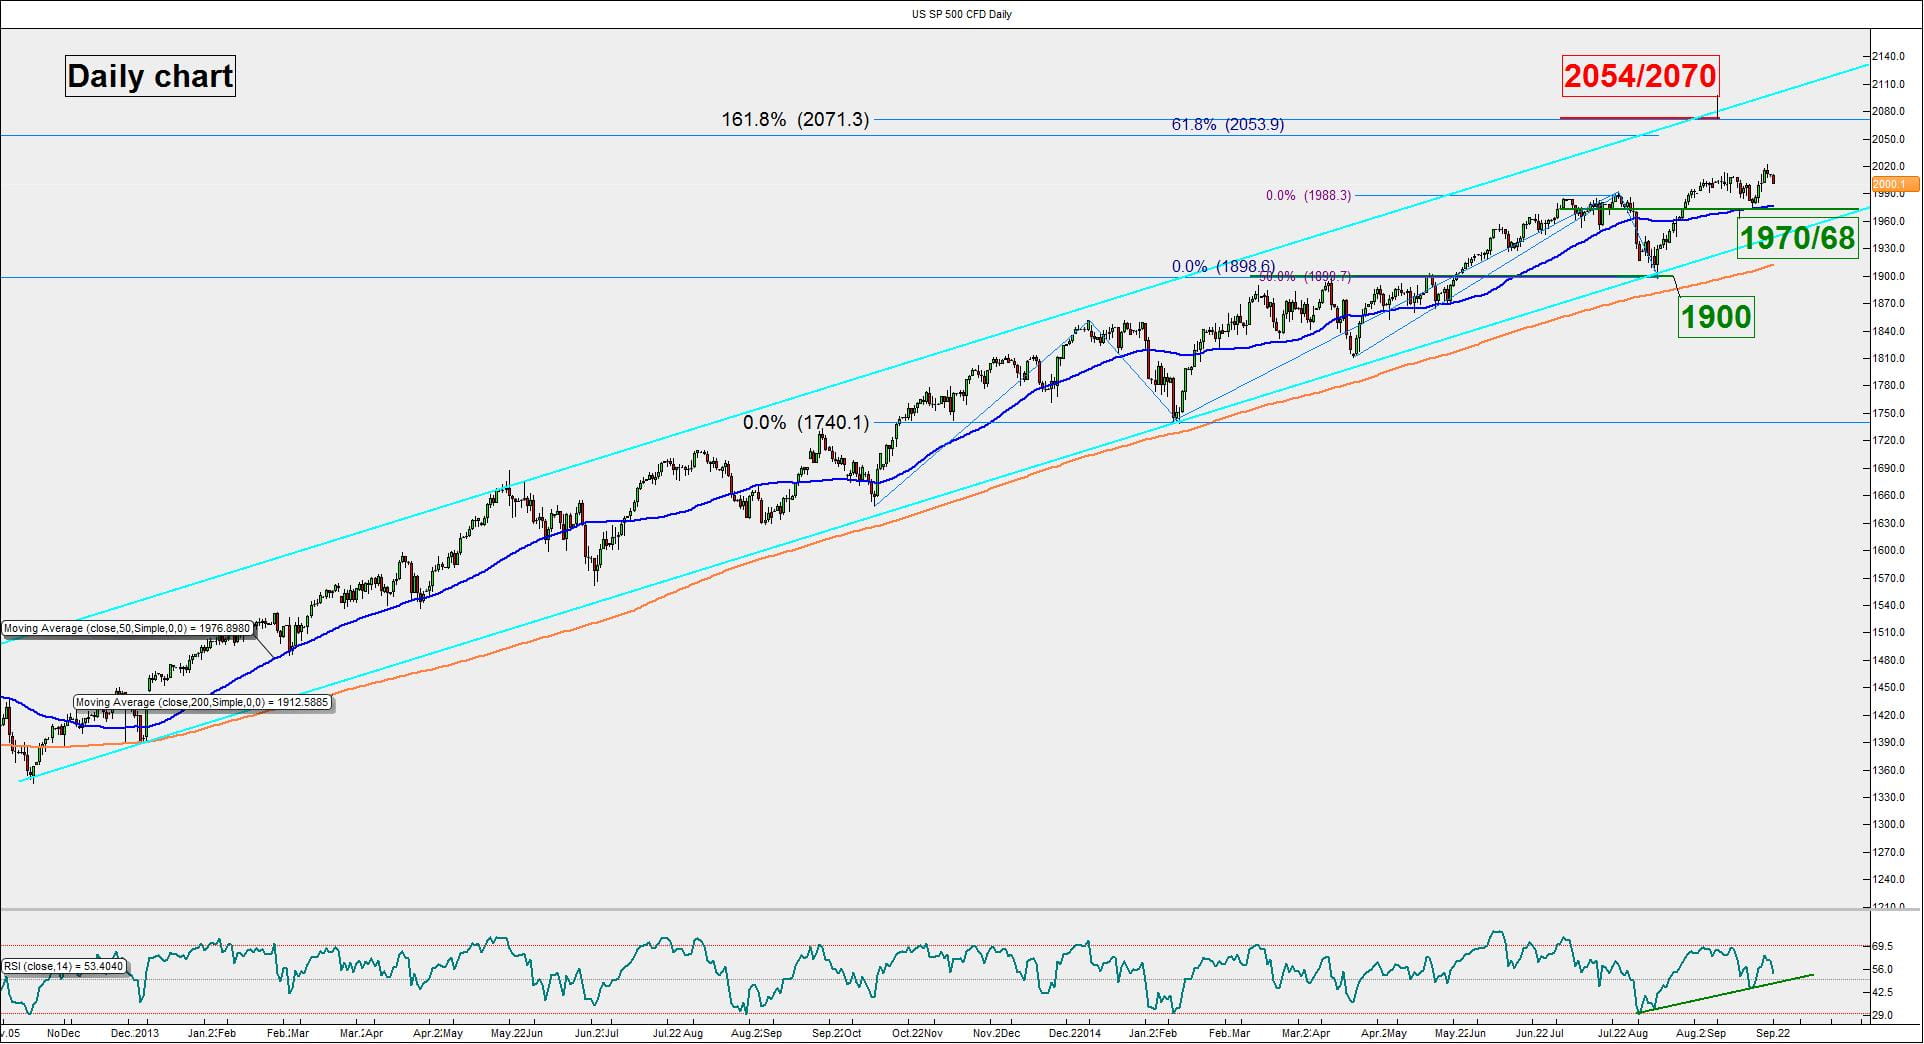
- The lower boundary of the ascending channel in place since 11 Nov 2012 low is now at 1970 (see weekly & daily charts).
- The 2054/2070 region corresponds with multiple Fibonacci projection levels from various degrees and the upper boundary of the ascending channel in place since 11 November 2012 low (see daily & weekly charts).
- The pull-back support of the long-term former ascending channel in place since March 2009 is at 1900 (see weekly chart).
- The 50-day Moving Average is coming to act as a support at around 1970 (see daily chart)
- The RSI oscillator remains above its trendline support (see daily chart).
- The former intermediate resistance now turns pull-back support at 1998 corresponds with the 23.6% Fibonacci retracement from 08 August 2014 low and lower boundary of the shorter-term term ascending channel (see 4 hour).
- The shorter-term Stochastic oscillator has dipped into the oversold region (see 4 hour chart).
Key levels (1 to 3 weeks)
Intermediate support: 1998
Pivot (key support): 1970/1968
Resistance: 2054/2070
Next support: 1943 & 1900
Conclusion
The multi-month bullish trend remains intact for the S&P 500 even though it staged a decline on last Friday. Based on the above mentioned elements, we expect a further pull-back towards 1998 with a maximum limit set at the 1970/1968 pivotal support before another round of potential upside movement occurs to target the 2054/2070 significant resistance zone.
However, a break below 1970/1968 may negate the bullish tone to see a further decline towards 1943 before the significant support at 1900.
Disclaimer
The information contained in this material is intended for general circulation only. It should not be construed as a recommendation, or an offer (or solicitation of an offer) to buy or sell any financial products. The information provided does not take into account your specific investment objectives, financial situation or particular needs. Before you act on any recommendation that may be contained in this report, independent advice ought to be sought from a financial adviser regarding the suitability of the investment product, taking into account your specific investment objectives, financial situation or particular needs. All queries regarding the contents of this material are to be directed to City Index Asia Pte Ltd.