



ASX 200 Evening Wrap: Tech and Banks Extend Losses, WOW Perks Up
The ASX 200 slipped for a second day as selling in banks and tech weighed on sentiment, though Woolworths stood out with renewed bullish momentum.
Share this:

The ASX 200 fell for a second straight session as weakness across the Financials and Technology sectors offset gains in defensives. Rising volume hinted at renewed bearish momentum, with a small shooting star candle beneath the 50-day EMA suggesting a potential swing high. Yet, not all was negative — Woolworths regained traction after October’s oversold reversal, helping the Consumer Staples sector log its strongest day in three months.
View related analysis:
View related analysis:
ASX 200 Market Snapshot
• The ASX 200 closed lower for a second straight day, with rising volume hinting at fresh bearish initiation.
• Volatility eased for a second session, though a small shooting star candle formed beneath the 50-day EMA, signalling a potential swing high.
• Consumer Staples (XSJ) and Energy (XEJ) led six sectors higher, while Information Technology (XIJ) and Consumer Discretionary (XDJ) extended losses, reinforcing a mild risk-off tone.
• 101 stocks advanced, 83 declined, and 16 were unchanged.
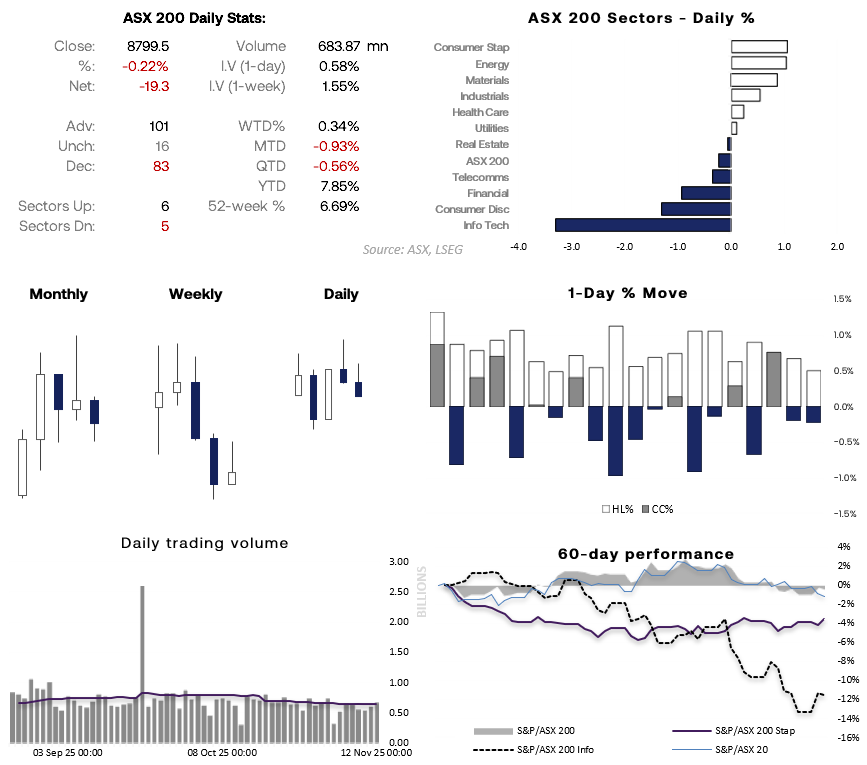
Chart analysis by Matt Simpson - source: ASX, LSEG
ASX 200 Sector Analysis
There’s a clear risk-off tone evident across ASX 200 sectors.
- Financials (XFJ) fell to a 22-day low after its fourth consecutive bearish session.
- Information Technology (XIJ) has dropped to a six-month low, with its established downtrend showing no sign of a bottom.
- Consumer Discretionary (XDJ) snapped a brief two-day rebound and is now on the verge of breaking to a five-month low.
- Consumer Staples (XSJ) rose on defensive rotation, with its 1% gain marking the strongest session in three months.
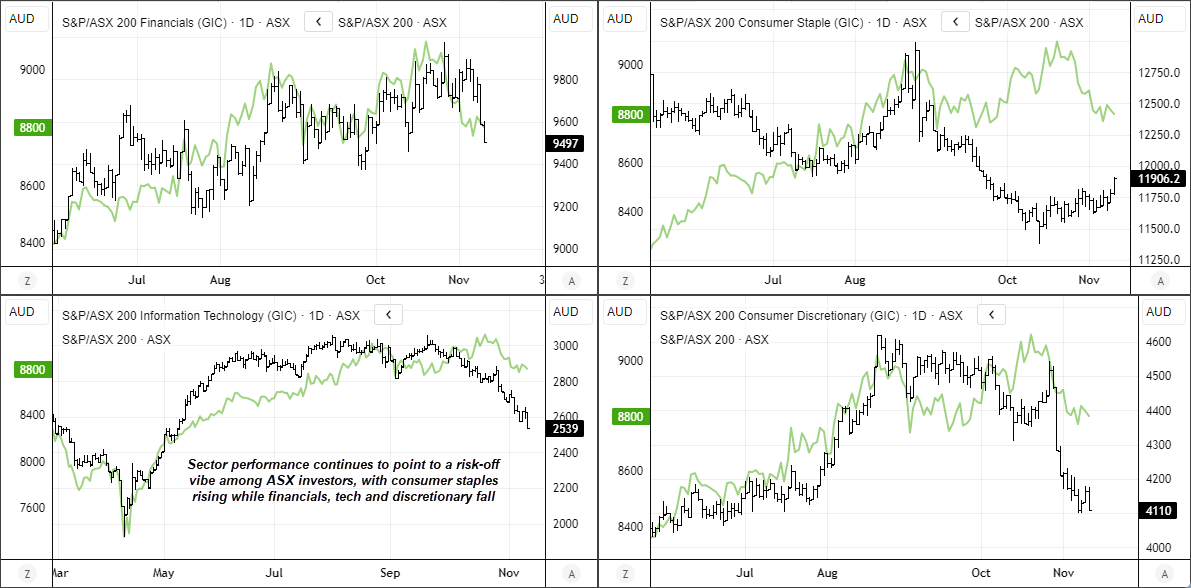
Chart analysis by Matt Simpson - source: ASX, LSEG


ASX 200 Technical Analysis
A small shooting star candle formed just below the 50-day EMA on Tuesday, and prices extended lower today. The ASX 200 now sits beneath the 8,879.6 swing high, keeping bears in control and raising the risk of a retest of the September low at 8,791.3. A break beneath that level would expose the support cluster between 8,615 and 8,640, where several prior highs and lows converge.
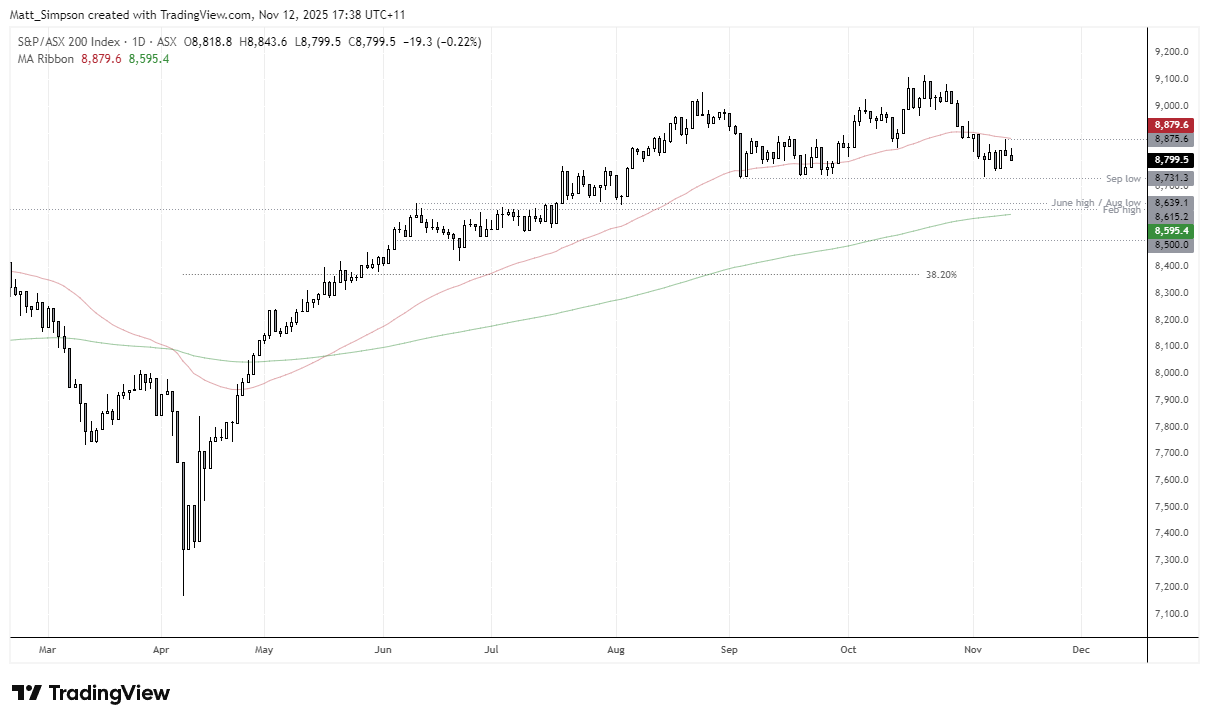
Chart analysis by Matt Simpson - source: ASX, TradingView
ASX 200 Top Stock Movers and Technical Setups
Woolworths (WOW) Regains Bullish Momentum
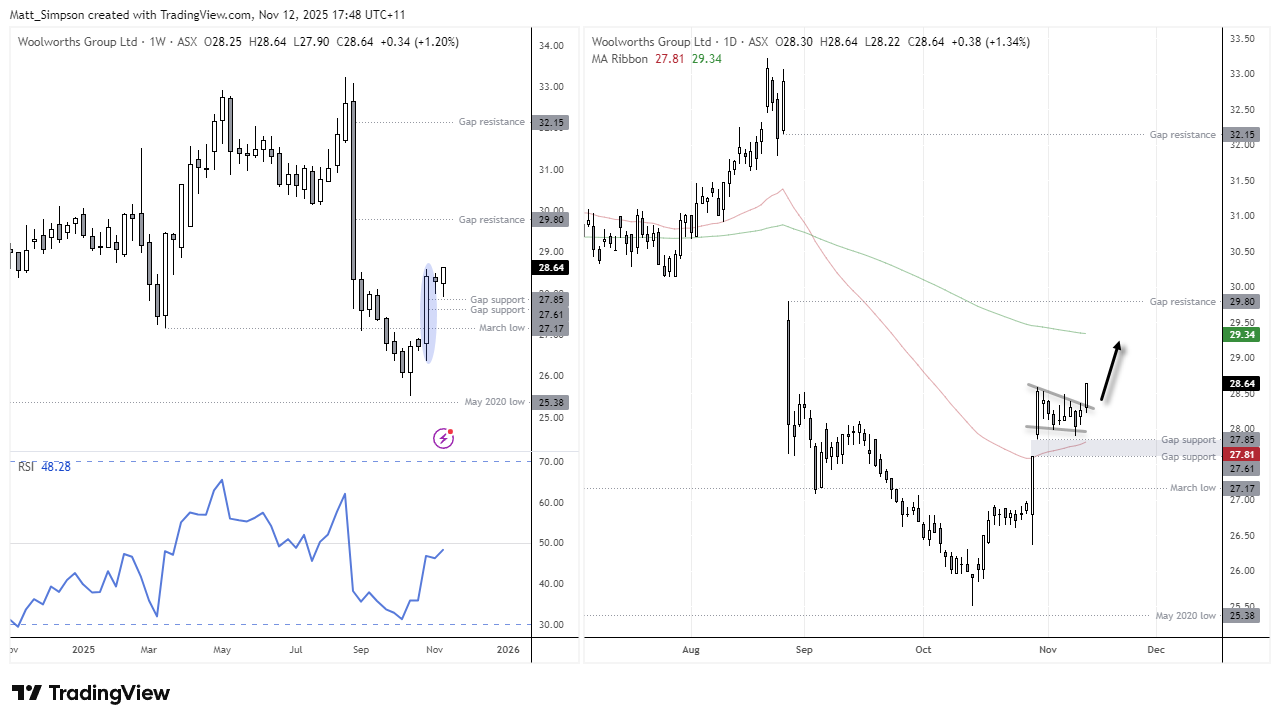
Back in October, I outlined a bullish bias for Woolworths despite bearish price action. I argued that it had sold off too sharply and was a strong candidate for mean reversion. The weekly chart confirms that bullish range expansion arrived in late October.
On the daily chart, prices have gapped above the 50-day EMA, and the subsequent retracement was shallow — holding above the upper gap support. Momentum has now turned higher, with the bias favouring a retest of the 200-day EMA (29.34) or the 29.80 gap resistance zone.
Source: ASX, TradingView.
Aristocrat Leisure (ALL) Falls to 6-Month Low
Aristocrat shares fell despite posting a 12% rise in profit and a higher dividend, as investors had already priced in strong results and focused instead on future growth. While the headline numbers were solid, performance outside North America lagged, margins came under pressure, and management’s outlook offered little new momentum.
ALL shares fell as much as 7.6% to a six-month low before rebounding above $60. The bearish engulfing candle, spanning a 9.2% high-to-low range, marked its most volatile session since May.
Banking Stocks Under Pressure
Commonwealth Bank (CBA) fell for a fourth day, testing its August low near the 160 handle amid rising volume. Westpac (WBC) also retreated from record highs, forming a small shooting star candle and closing back below $40 after a false intraday break.
Rio Tinto (RIO)Hits 6-Day High
TIO shares hit a 6-day high on reports that it had partnered up with Nano-One for lithium and invested GBP 300 million into energy storage.


View the full economic calendar
View the full economic calendar
-- Written by Matt Simpson
Follow Matt on Twitter @cLeverEdge
How to trade with City Index
You can trade with City Index by following these four easy steps:
- Open an account, or log in if you’re already a customer
• Open an account in the UK
• Open an account in Australia
• Open an account in Singapore
- Search for the market you want to trade in our award-winning platform
- Choose your position and size, and your stop and limit levels
- Place the trade
Related tags:
Latest market news




Open an account in minutes
Experience award-winning platforms with fast and secure execution.
Economic calendar
Web Trader platform
Our sophisticated web-based platform is packed with features.
Related articles
S&P 500, Nasdaq 100 Claw Back But NVDA Cloud Looms Overhead
Last week was green for both the Nasdaq and S&P 500 but given the sell-off that led into that bounce there’s still a very real question as to whether bears still have a statement to make. And the NVDA situation presents a very real threat.
Nvidia Earnings Preview: NVDA’s First Test of the Post Jenson Huang Era
Nvidia is expected to report $2.47 in EPS on $108.8B in revenue this quarter, but investors will be more interested in the company's guidance after the unexpected departure of founder and CEO Jenson Huang.


US dollar forecast: USD/JPY and USD/CHF in focus | Forex Friday
Sticky US inflation and a hawkish Fed have kept the dollar firm across the majors, with USD/JPY pressing on the 160 handle. Here are the levels that matter on USD/JPY and USD/CHF as next week's retail sales, Nvidia results and FOMC minutes approach.

The information on this web site is not targeted at the general public of any particular country. It is not intended for distribution to residents in any country where such distribution or use would contravene any local law or regulatory requirement. The information and opinions in this report are for general information use only and are not intended as an offer or solicitation with respect to the purchase or sale of any currency or CFD contract. All opinions and information contained in this report are subject to change without notice. This report has been prepared without regard to the specific investment objectives, financial situation and needs of any particular recipient. Any references to historical price movements or levels is informational based on our analysis and we do not represent or warranty that any such movements or levels are likely to reoccur in the future. While the information contained herein was obtained from sources believed to be reliable, author does not guarantee its accuracy or completeness, nor does author assume any liability for any direct, indirect or consequential loss that may result from the reliance by any person upon any such information or opinions.
Futures, Options on Futures, Foreign Exchange and other leveraged products involves significant risk of loss and is not suitable for all investors. Losses can exceed your deposits. Increasing leverage increases risk. Spot Gold and Silver contracts are not subject to regulation under the U.S. Commodity Exchange Act. Contracts for Difference (CFDs) are not available for US residents. Before deciding to trade forex, commodity futures, or digital assets, you should carefully consider your financial objectives, level of experience and risk appetite. Any opinions, news, research, analyses, prices or other information contained herein is intended as general information about the subject matter covered and is provided with the understanding that we do not provide any investment, legal, or tax advice. You should consult with appropriate counsel or other advisors on all investment, legal, or tax matters. References to FOREX.com or GAIN Capital refer to StoneX Group Inc. and its subsidiaries. Please read Characteristics and Risks of Standardized Options.