



AUD/USD, GBP/USD Price Action Setups Ahead of US Inflation
AUD/USD and GBP/USD hold key support levels ahead of US CPI, with traders watching for breakout potential as the US dollar rally nears exhaustion.
Share this:

The persistent US government shutdown has generally kept a lid on runaway volatility across major forex pairs. Fortunately, traders still had some action this week — with a mini-rout in gold and an explosive move higher in crude oil prices keeping things lively. But with US CPI data due later today, there’s potential for volatility to return ahead of the weekend.
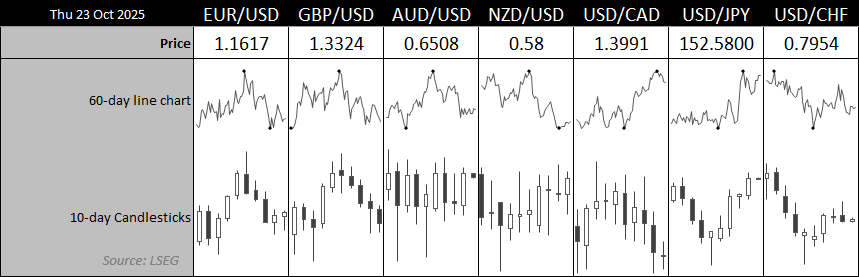
Chart analysis by Matt Simpson - Source: LSEG
View related analysis:
View related analysis:
AUD/USD and GBP/USD Eye Breakout Zones as US CPI Looms
US Inflation in Focus
Headline CPI is expected to rise to 3.1% year-on-year, while core CPI is forecast to hold steady at 3.1% year-on-year and 0.3% month-on-month. Money markets are currently pricing in a 25bp rate cut from the Fed next week and another in December, with implied probabilities of 99% and 93% respectively. A hotter-than-expected CPI print could challenge those expectations and send the US dollar higher across the board.

Chart analysis by Matt Simpson - Source: LSEG, Investing.com
Still, my hunch is that inflation will come in softer, supporting current market pricing. As noted in recent articles, I suspect the US dollar’s rebound this week is nearing an inflection point — and its next meaningful move is likely lower.
That scenario could bode well for the Australian dollar heading into next week, particularly with Australia’s key inflation report on the horizon for the RBA.


AUD/USD Technical Analysis: Australian Dollar vs US Dollar
The daily chart shows the Australian dollar has continued to trade sideways over the past couple of weeks. Since last Wednesday, however, the open and close prices have mostly held above the September low. AUD/USD’s open-to-close range has remained below 35 pips since last Tuesday, and daily ranges have been trending lower. This suggests prices are coiling above support — often a precursor to increased volatility.
At this stage, my hunch is that AUD/USD will initially break higher from its current range before meeting resistance below 0.6550, or perhaps around the descending trendline. Whether the pair then continues to break higher or reverse lower likely depends on the tone of next week’s FOMC meeting and Australia’s quarterly inflation figures.
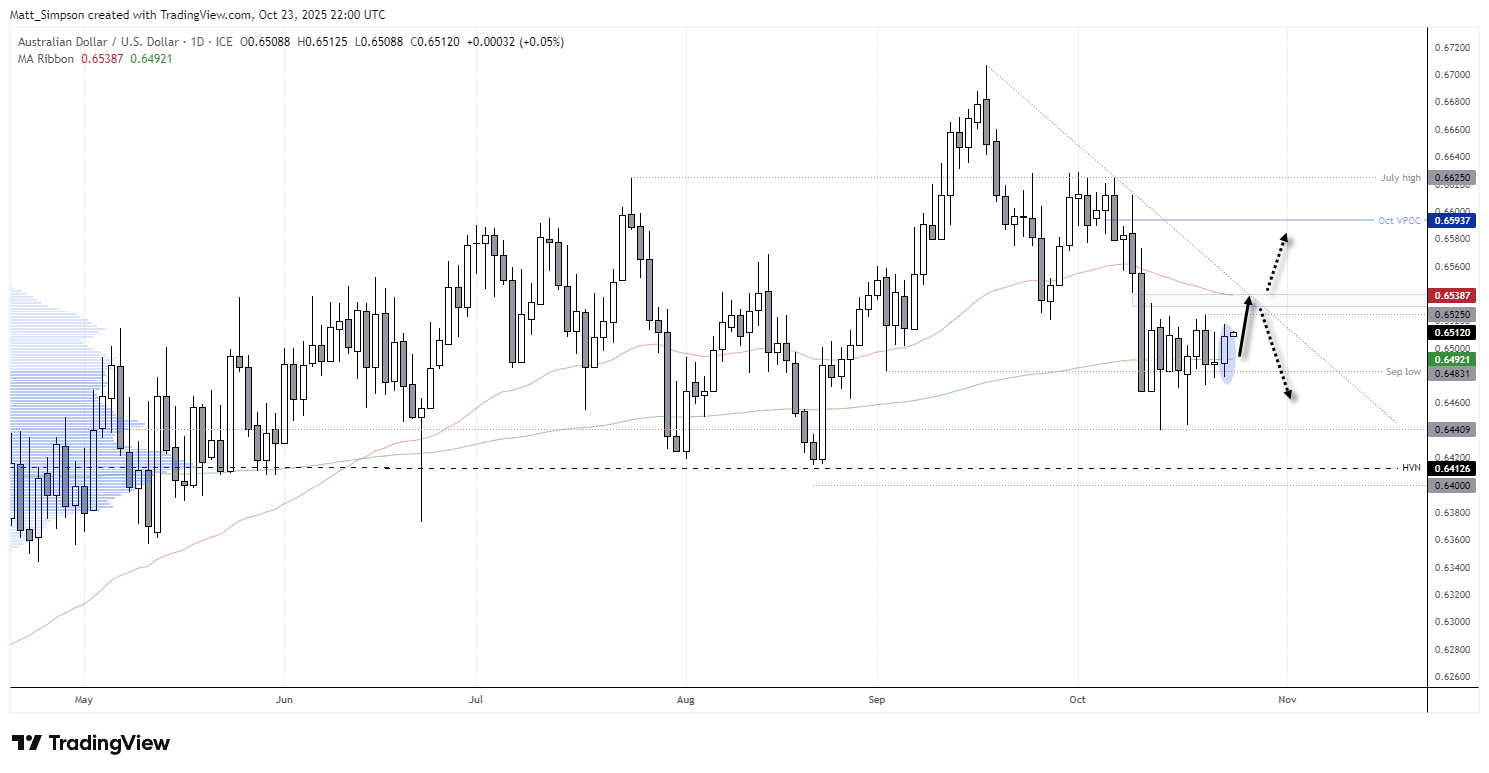
Chart analysis by Matt Simpson - data source: TradingView AUD/USD


GBP/USD Technical Analysis: British Pound vs US Dollar
Mostly based on the assumption that the US dollar will top out, I have provided a bullish bias for the British pound against the US dollar – should it hold above Wednesday’s low. The daily chart shows that this is being stretched, and there may need to be some wriggle room for some CPI-related noise beneath Wednesday’s low to allow the potential for a bounce to breath.
While bets are now being renewed for a Bank of England (BOE) cut, GBP/USD has already fallen for five consecutive days. The daily RSI (2) is in the oversold zone, and prices are trying to hold above that hammer low, for now at least.
ON the basis that the 200-day EMA is a tough nut to crack and my hunch for a weaker US dollar, I’ll stick to my guns and eek a move higher on the GBP/USD daily chart, with the 50-day EMA as a potential bullish target.
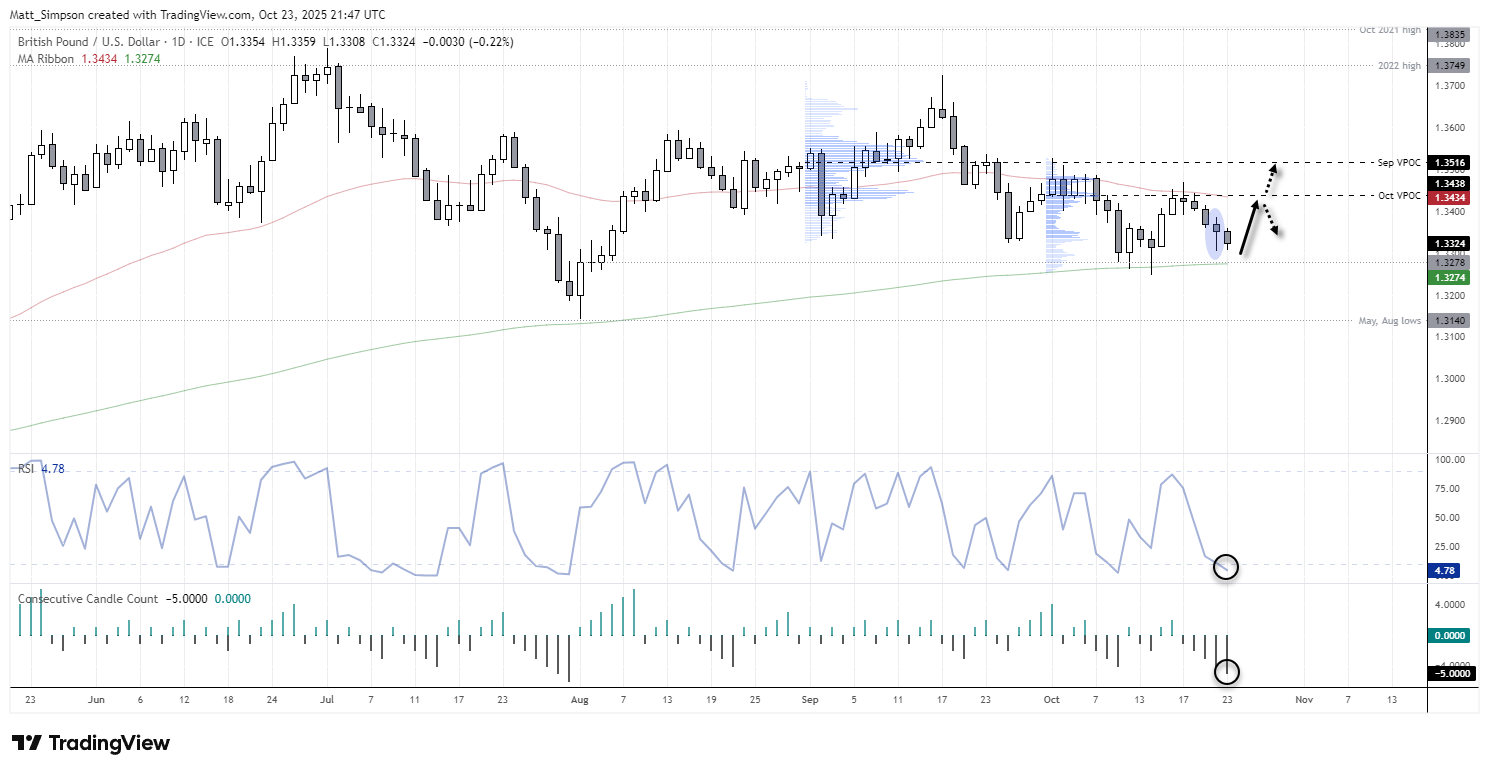
Chart analysis by Matt Simpson - data source: TradingView GBP/USD
View the full economic calendar
View the full economic calendar
-- Written by Matt Simpson
Follow Matt on Twitter @cLeverEdge
How to trade with City Index
You can trade with City Index by following these four easy steps:
- Open an account, or log in if you’re already a customer
• Open an account in the UK
• Open an account in Australia
• Open an account in Singapore
- Search for the market you want to trade in our award-winning platform
- Choose your position and size, and your stop and limit levels
- Place the trade
Related tags:
Latest market news




Open an account in minutes
Experience award-winning platforms with fast and secure execution.
Economic calendar
Web Trader platform
Our sophisticated web-based platform is packed with features.
Related articles
Australian Dollar Forecast: AUD/USD Breaks Multi-Month Range, Hits 10-Month Low 11 14 2026
Aussie bears are closing in on major technical support, with next week's Australian employment data raising the stakes for a pivotal reaction.

USD/JPY Weekly Outlook: Bulls Eye Higher Range After Historic Rate Shock
A historic US rate shock has sent USD/JPY above 160, but with intervention risks rising and few major economic catalysts ahead, AI sentiment could hold the key to the next move.

US Dollar Price Action Setups: EUR/USD, USD/JPY
The US Dollar broke out to a fresh yearly high after the CPI report, and that Dollar strength was on full view in pretty much all major pairings with a particular push in EUR/USD.
The information on this web site is not targeted at the general public of any particular country. It is not intended for distribution to residents in any country where such distribution or use would contravene any local law or regulatory requirement. The information and opinions in this report are for general information use only and are not intended as an offer or solicitation with respect to the purchase or sale of any currency or CFD contract. All opinions and information contained in this report are subject to change without notice. This report has been prepared without regard to the specific investment objectives, financial situation and needs of any particular recipient. Any references to historical price movements or levels is informational based on our analysis and we do not represent or warranty that any such movements or levels are likely to reoccur in the future. While the information contained herein was obtained from sources believed to be reliable, author does not guarantee its accuracy or completeness, nor does author assume any liability for any direct, indirect or consequential loss that may result from the reliance by any person upon any such information or opinions.
Futures, Options on Futures, Foreign Exchange and other leveraged products involves significant risk of loss and is not suitable for all investors. Losses can exceed your deposits. Increasing leverage increases risk. Spot Gold and Silver contracts are not subject to regulation under the U.S. Commodity Exchange Act. Contracts for Difference (CFDs) are not available for US residents. Before deciding to trade forex, commodity futures, or digital assets, you should carefully consider your financial objectives, level of experience and risk appetite. Any opinions, news, research, analyses, prices or other information contained herein is intended as general information about the subject matter covered and is provided with the understanding that we do not provide any investment, legal, or tax advice. You should consult with appropriate counsel or other advisors on all investment, legal, or tax matters. References to FOREX.com or GAIN Capital refer to StoneX Group Inc. and its subsidiaries. Please read Characteristics and Risks of Standardized Options.