



AUD/USD Weekly Outlook: Odds of a Bullish Breakout on the Rise
The Australian dollar rallied as dip buyers returned, with AUD/USD eyeing resistance near 0.66 while RBA caution and Fed cuts shape direction.
Share this:

The Australian dollar (AUD/USD) closed last week strongly as dip buyers stepped in, pushing the pair into a four-day rally and leaving a bullish engulfing weekly candle. With the RBA in no rush to cut, Australian inflation staying sticky, and the Fed preparing to ease policy, conditions are aligning for a potential breakout above the 0.66 handle. Futures positioning and correlations suggest AUD/USD could remain supported in a weak-USD environment, with bulls likely to buy into dips for another leg higher.
View related analysis:
View related analysis:
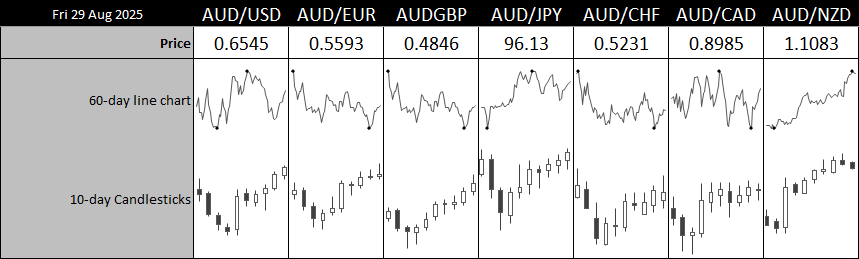
Chart analysis by Matt Simpson - data source: ABS, LSEG
AUD/USD Outlook: Bullish Breakout Risks Grow for the Australian Dollar
RBA To Remain Cautious On The Outlook
Wednesday’s GDP report is expected to show sluggish growth in Q2, with Westpac forecasting the annualised rate for 2025 to slow to 1.3% — well below the RBA’s 1.8% forecast. With employment the only metric still showing resilience, it’s hard to see how growth figures could deliver any meaningful upside surprise.

Chart analysis by Matt Simpson - data source: ABS, LSEG
Australia’s inflation figures came in higher across the board. While many were quick to point to the temporary spike in electricity prices as the main driver, I don’t see anything in the broader dataset to justify RBA cuts any time soon. Rents and fuel also pushed higher, and the only faint sign of disinflation was in transportation.
Private new capital expenditure for Q2 underwhelmed at 0.2% q/q versus 0.8% expected. However, Westpac noted that its spending plan estimate for this financial year is 3.1% higher than last year’s. Construction work rose 3% in the June quarter, largely driven by mining, though it is still up 4.8% y/y. The Australian economy may not be running hot, but it’s not in the gutter either. Again, this suggests the RBA will stay on hold into Q4 at a minimum.
Fed Remain On Track For September Cut
Fed funds futures continue to point to a September cut from the Fed despite core PCE inflation rising to 2.9% y/y. On Friday, FOMC member Daly said it will “soon be time to recalibrate policy.” Odds of another 25bp cut in October or December sit just below 50%, with expectations tapering off the further out we look.

Chart analysis by Matt Simpson - data source: ISM, LSEG
Incoming US data will shape whether another cut is delivered this year, with NFP and ISM reports the main events to watch. With services prices paid trending higher and manufacturing prices still elevated, even a slight dip lower could bolster bets of an October–December cut and provide further support for AUD/USD.
The same goes for Friday’s Nonfarm Payrolls report. Employment growth has been trending lower for three years, so any further weakness — or a rise in unemployment — could see traders betting on a follow-up cut beyond September.
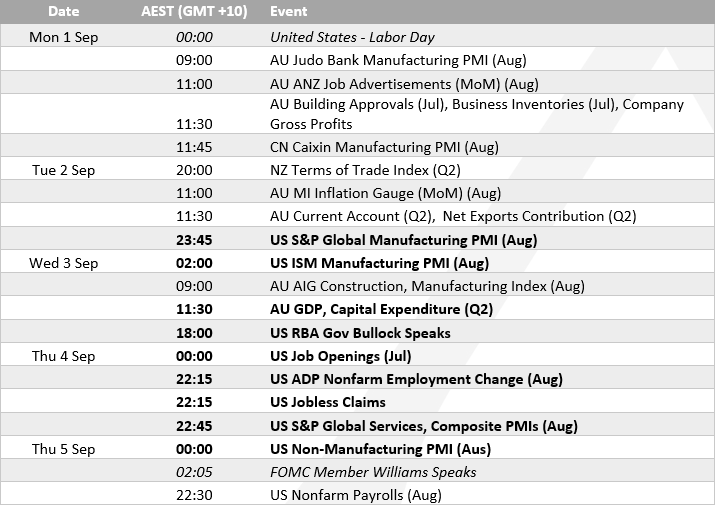
Chart analysis by Matt Simpson - data source: Investing.com
AUD/USD Correlations
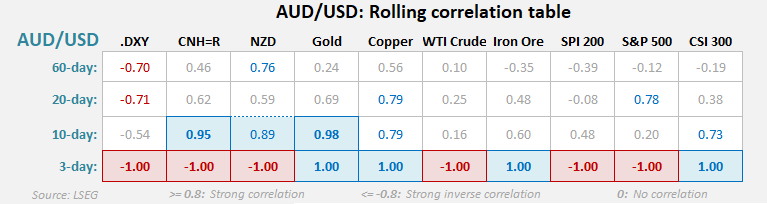
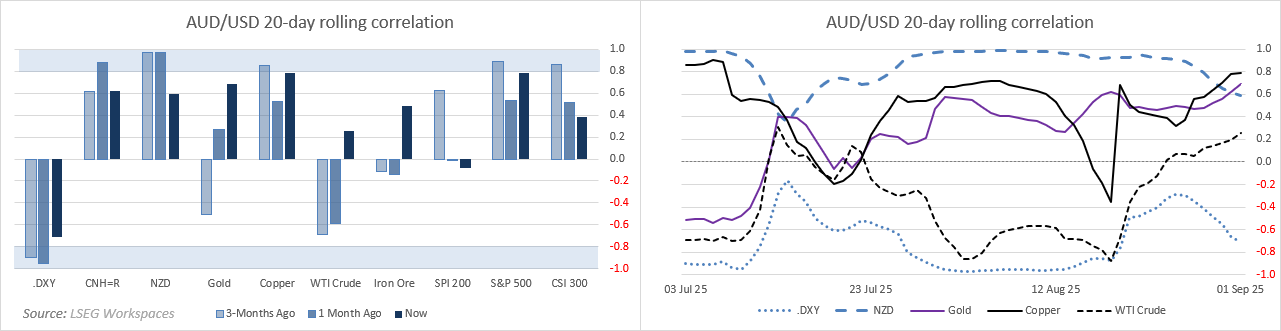
Chart analysis by Matt Simpson - data source: LSEG
AUD/USD Futures Positioning - COT Report
- Net-short exposure to AUD/USD futures continued to rise last week, with bearish exposure reaching their highest levels since April 2014.
- Both sets of traders increased gross-short exposure and decreased gross-longs.
- Yet The Australian dollar continued to rise into the weekly close thanks to the weaker US dollar.
- I suspect AUD/USD is likely to remain supported in the current weak-USD environment, and the odds of a bullish breakout are on the rise.
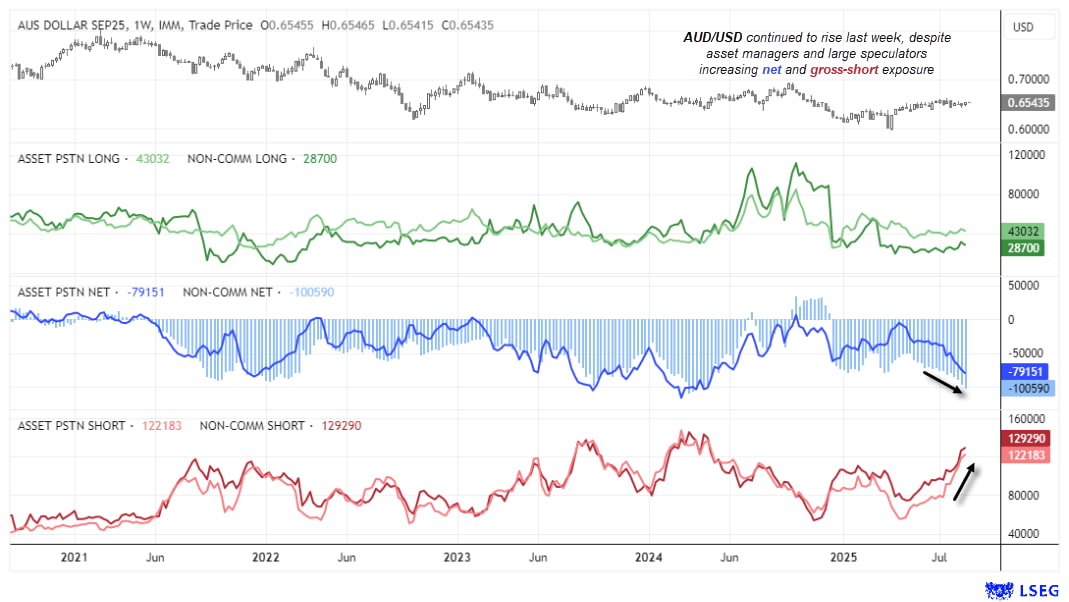
Chart analysis by Matt Simpson - data source: CME, IMM, LSEG
AUD/USD Technical Analysis
Australian dollar dip buyers were seemingly rewarded last week. The 50-week EMA held perfectly for Wednesday’s low before the week closed with a 4-day winning streak and a bullish engulfing weekly candle. The 20-week EMA is above the 50-week, and both averages are pointing higher. AUD/USD appears to have the hallmarks of a market that is about to extend its rally.
So my core theme remains the same as last week’s: bulls are likely on standby for dips, eyeing a run towards – and potential breakout above – the 66c handle.
Note the July VPOC and weekly R1 pivot around the 0.6587 high, a break above which brings the 66c handle into focus for bulls.
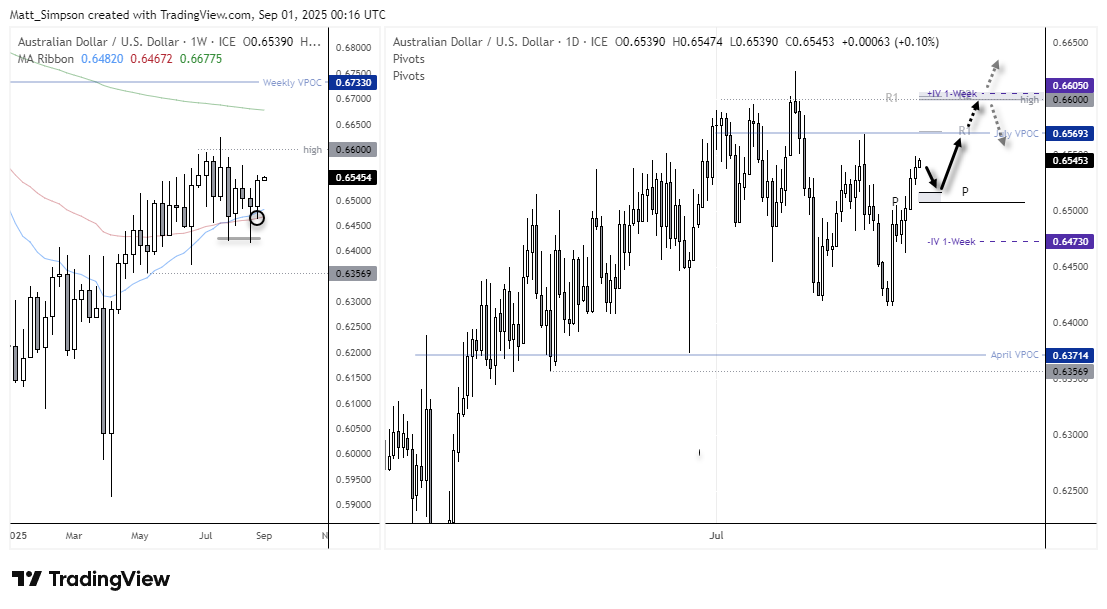
Chart analysis by Matt Simpson - data source: TradingView AUD/USD
View the full economic calendar
View the full economic calendar
-- Written by Matt Simpson
Follow Matt on Twitter @cLeverEdge
How to trade with City Index
You can trade with City Index by following these four easy steps:
- Open an account, or log in if you’re already a customer
• Open an account in the UK
• Open an account in Australia
• Open an account in Singapore
- Search for the market you want to trade in our award-winning platform
- Choose your position and size, and your stop and limit levels
- Place the trade
Latest market news




Open an account in minutes
Experience award-winning platforms with fast and secure execution.
Economic calendar
Web Trader platform
Our sophisticated web-based platform is packed with features.
Related articles
Australian Dollar Forecast: AUD/USD Breaks Multi-Month Range, Hits 10-Month Low 11 14 2026
Aussie bears are closing in on major technical support, with next week's Australian employment data raising the stakes for a pivotal reaction.


AUD/USD Outlook: Historic yield squeeze leaves Aussie bears in control
Australian bond yields have fallen below their US equivalents as the Fed's hawkish repricing gathers momentum. With the Aussie weakening broadly, technical signals suggest sellers remain in control.


ASX 200 Outlook: Sector Rotation Builds as Rally Nears Record High
The ASX 200 nears record highs as sector rotation gathers pace. Could the RBA be nearing peak rates, and will resistance at 9200 trigger a pullback?
The information on this web site is not targeted at the general public of any particular country. It is not intended for distribution to residents in any country where such distribution or use would contravene any local law or regulatory requirement. The information and opinions in this report are for general information use only and are not intended as an offer or solicitation with respect to the purchase or sale of any currency or CFD contract. All opinions and information contained in this report are subject to change without notice. This report has been prepared without regard to the specific investment objectives, financial situation and needs of any particular recipient. Any references to historical price movements or levels is informational based on our analysis and we do not represent or warranty that any such movements or levels are likely to reoccur in the future. While the information contained herein was obtained from sources believed to be reliable, author does not guarantee its accuracy or completeness, nor does author assume any liability for any direct, indirect or consequential loss that may result from the reliance by any person upon any such information or opinions.
Futures, Options on Futures, Foreign Exchange and other leveraged products involves significant risk of loss and is not suitable for all investors. Losses can exceed your deposits. Increasing leverage increases risk. Spot Gold and Silver contracts are not subject to regulation under the U.S. Commodity Exchange Act. Contracts for Difference (CFDs) are not available for US residents. Before deciding to trade forex, commodity futures, or digital assets, you should carefully consider your financial objectives, level of experience and risk appetite. Any opinions, news, research, analyses, prices or other information contained herein is intended as general information about the subject matter covered and is provided with the understanding that we do not provide any investment, legal, or tax advice. You should consult with appropriate counsel or other advisors on all investment, legal, or tax matters. References to FOREX.com or GAIN Capital refer to StoneX Group Inc. and its subsidiaries. Please read Characteristics and Risks of Standardized Options.