


As the week approaches its close, selling pressure on Bitcoin shows no signs of easing. During today’s session alone, the cryptocurrency has fallen more than 13%, a move of this magnitude not seen since 2024, highlighting the strength of the current bearish bias. The decline has been driven by a lack of market appetite and a rapid deterioration in confidence, factors that are acting as key short-term catalysts for selling pressure, which may remain relevant over the coming sessions.

Demand begins to fade
This week has been particularly challenging for Bitcoin. The strengthening of substitute assets, such as the U.S. dollar, combined with a broader decline in risk appetite, has led key indicators to reflect a lack of interest in sustaining demand for the cryptocurrency.
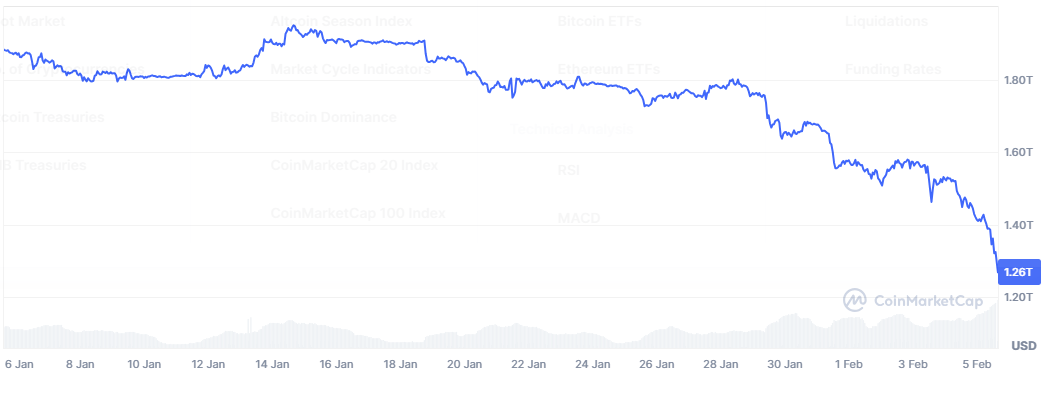
In this environment, Bitcoin’s market capitalization is approaching the $1.26 trillion area, after starting the month above $1.5 trillion. This implies that in just a few sessions, the market has lost nearly $300 billion in capitalization, pointing to an accelerated outflow of capital and reinforcing a consistent loss of confidence that currently fails to support demand.
Source: Coinmarketcap
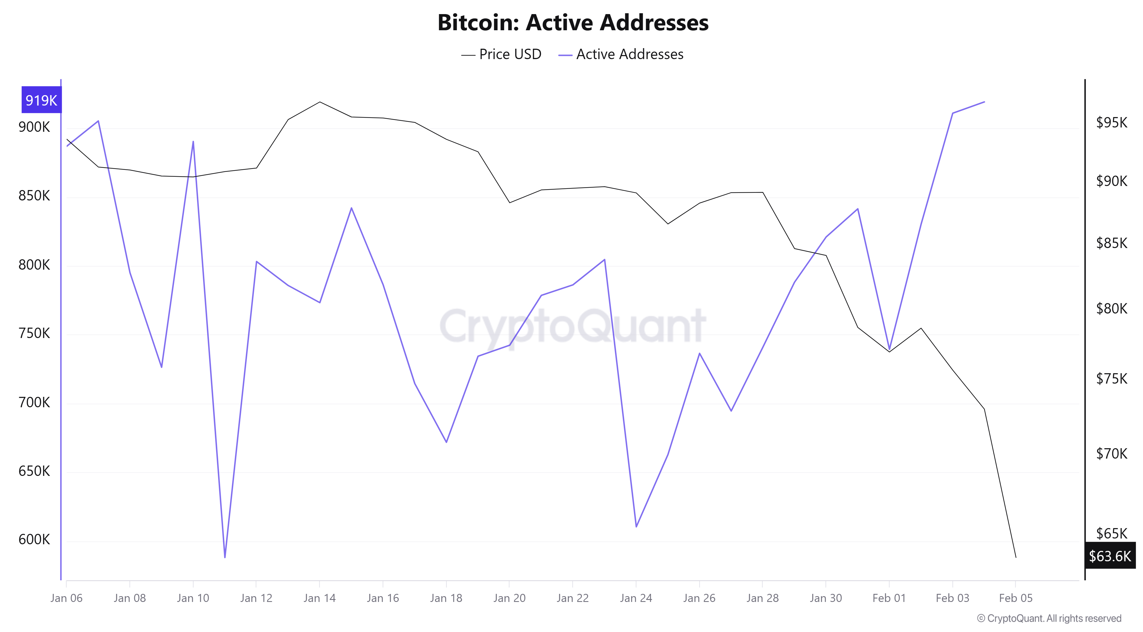
This deterioration in appetite is also evident in the retail market. On the Bitcoin network, there has been a significant increase in the number of active addresses, now nearing 920,000. This rise, combined with the sharp price decline, suggests that a large portion of these addresses is oriented toward selling, indicating that retail participants are not absorbing the dip, but rather actively contributing to the loss of demand.
Source: Cryptoquant
Taken together, these factors confirm a steady outflow of capital and an environment dominated by forced liquidations, as Bitcoin continues to break key technical levels. Capital appears to be rotating toward assets perceived as more attractive, such as the U.S. dollar, further diminishing demand for BTC. Until this dynamic stabilizes, dominant selling pressure is likely to continue shaping short-term market behavior.
Confidence moves into critical territory
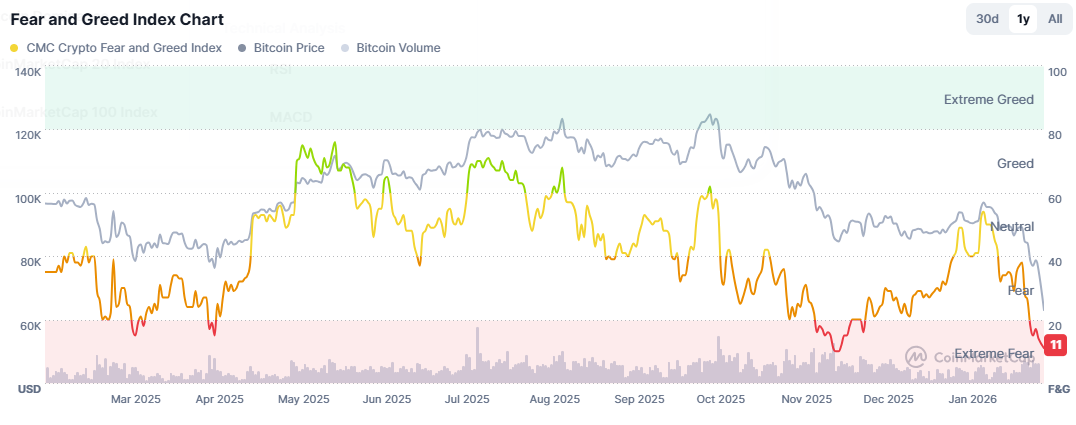
Crypto market confidence continues to deteriorate. The Fear and Greed Index is currently hovering around 11 points, levels not seen since November 2025, confirming a clear move into “extreme fear” territory. This behavior indicates that short-term confidence remains severely compromised, with no clear incentive to rebuild demand for Bitcoin at this stage.
Source: Coinmarketcap
As long as sentiment indicators remain in extreme fear, it will be difficult to sustain an environment conducive to a meaningful recovery. This backdrop not only delays potential rebounds, but also reinforces a structural bearish bias, which could continue to dominate BTC’s short-term price action.
Bitcoin Technical Outlook
Source: StoneX, Tradingview
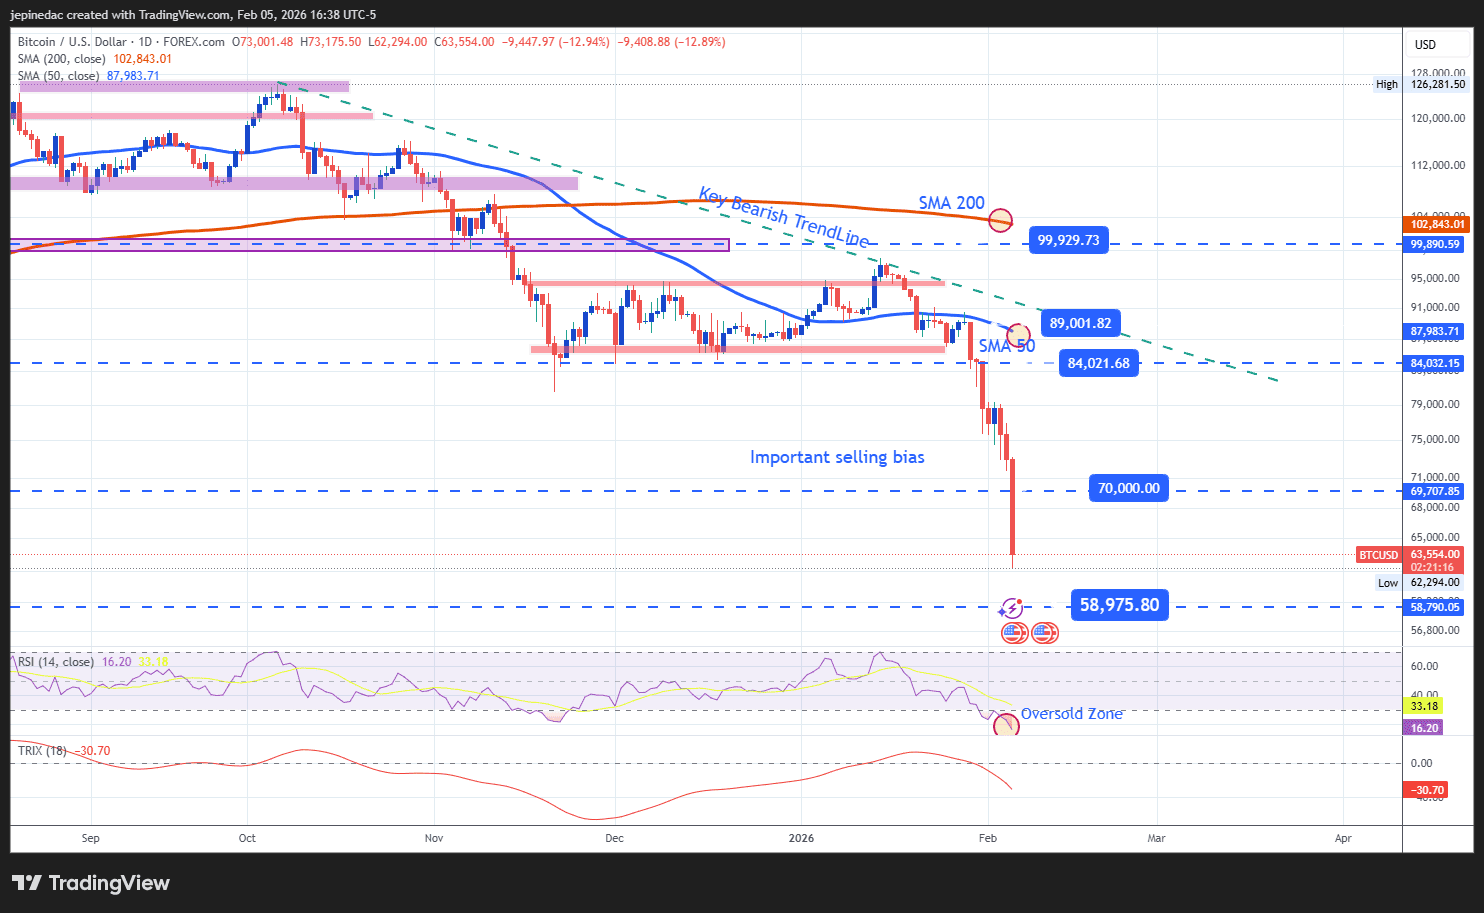
- The bearish trend dominates the market: Bitcoin has maintained a well-defined downtrend since its latest all-time highs. So far, no significant bullish correction has emerged to threaten this technical structure, keeping it as the dominant pattern. That said, the magnitude of the recent sell-off does leave room for short-term technical bounces, though these do not necessarily imply a trend reversal.
- RSI: The RSI remains below the neutral level and has pushed deeply into oversold territory (30), signaling a recent excess of selling pressure. This setup may allow for short-term technical rebounds, albeit within a broader bearish context.
- TRIX: The TRIX continues to trade below the zero line, confirming that the long-term bias in exponential moving averages remains bearish. Until this indicator shows clear signs of reversal, underlying selling pressure is likely to continue dominating the market.
Key levels:
- $84,000 – Key resistance: An area aligned with the 50-period simple moving average and the bearish trendline. A sustained move toward this level could challenge the bearish structure and open the door to a more meaningful bullish bias in the medium term.
- $70,000 – Nearby barrier: A key psychological level, which may serve as a reference for short-term corrective moves.
- $58,000 – Definitive support: An area corresponding to the October 2024 lows, now standing as the most relevant downside barrier. A sustained break below this level could trigger a more aggressive extension of the downtrend, with significant implications for the sessions ahead.
Written by Julian Pineda, CFA, CMT – Market Analyst
Follow him on: @julianpineda25






