- Bitcoin rebounds sharply despite continued weakness in technology futures
- BTC/USD correlations with Nasdaq, SOX and Kospi futures strengthen
- Bearish reversal signals favour selling rallies, with $82,277.67 in focus
Bitcoin has had a volatile session in Asia, closely tracking the sell-off in technology-related futures. However, after an initial lurch lower, we've seen a sharp reversal take place.
What's notable is that we haven't seen a recovery in technology-related stock futures accompany it, putting a question mark over whether the rebound is anything more than a dead-cat bounce.
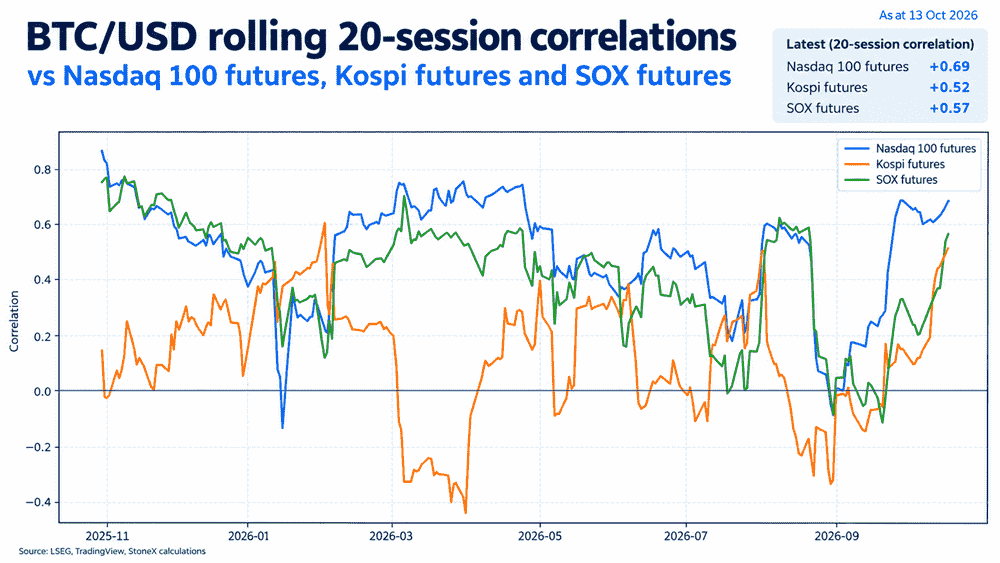
Bitcoin's relationship with equity futures strengthens
Source: TradingView, LSEG
While the correlations aren't at particularly extreme levels, its noticeable how the relationship between Bitcoin and tech-linked equity futures has strengthened since the beginning of October, particularly over the rolling 20-session window.
The latest readings stand at +0.69 against Nasdaq 100 futures, +0.57 against SOX futures and +0.52 against Kospi futures.
It suggests Bitcoin may be reverting to its old ways of acting as a barometer of risk sentiment and potentially a proxy for global liquidity. Whatever the underlying factor, Bitcoin is increasingly moving in lockstep with broader risk sentiment, particularly in the AI-related space.
Bearish reversals point to downside risks
Source: TradingView
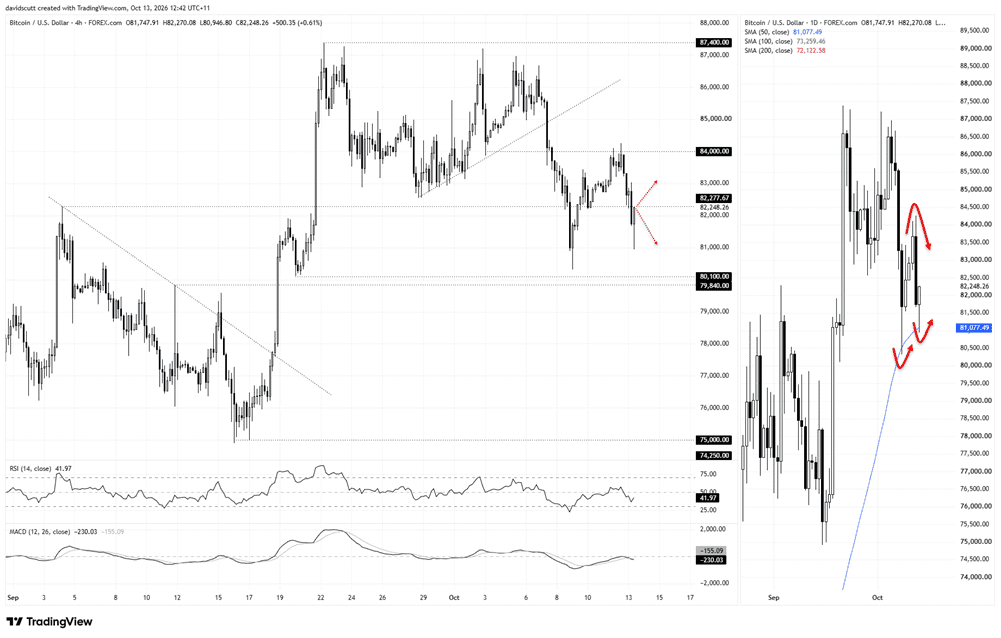
Turning to the charts, we've seen a bearish key reversal on the daily timeframe, while on the four-hourly chart, a bearish engulfing candle emerged after the price stalled above $84,000, followed by another that took BTC/USD beneath support at $82,277.67.
While the daily key reversal hasn't appeared following a prolonged bull market run, the price action across both timeframes suggests downside risks are elevated.
We saw that initially in early Asian trade, with the price tumbling beneath $81,000, where the 50-day moving average is located, before bouncing aggressively, as was the case earlier this month.
Looking at the four-hourly timeframe on the left, the immediate level I'm watching overhead is $82,277.67, which marked the swing high set in early September and has subsequently flipped between support and resistance on several occasions this month.
Should we see a backtest and rejection of $82,277.67, it would present an opportunity to initiate shorts with a tight stop above the level for protection, targeting initially the 50-day moving average around $81,000.
Beyond that, the next natural level to watch is last week's low at $80,319.46, followed by the support zone between $80,100 and $79,840.
Alternatively, should the price break convincingly above $82,277.67 and hold there, it would present an opportunity to initiate longs with a tight stop beneath the level for protection, targeting a retest of resistance at $84,000. The $83,000 level is also worth watching in between, having briefly stalled the price overnight.
The message from the oscillators on the four-hourly timeframe is one of building downside pressure, with RSI (14) setting lower highs and now sitting beneath the neutral 50 level, while MACD has staged a bearish crossover, confirming the bearish momentum signal.
That favours selling into strength and downside breaks, although I'm placing greater emphasis on price action when it comes to trade selection.