



EUR/USD, GBP/USD, AUD/USD, Oil, Equities Weekly Technical Outlook
Sr. Technical Strategist Michael Boutros highlights the levels that matter on the USD Majors, commodities, and equity indices charts this week.
Share this:

Weekly Technical Trade Levels on USD Majors, Commodities & Stocks
- Technical trade setups we are tracking into the start of the week on the USD Majors, commodities, and equity indices.
- Next Weekly Strategy Webinar: Monday, July 27 at 8:30am ET
- Review the latest Video Updates or Stream Live on my YouTube playlist
In this webinar we take an in-depth look at the technical trade levels for the US Dollar (DXY), Euro (EUR/USD), British Pound (GBP/USD), Australian Dollar (AUD/USD), Canadian Dollar (USD/CAD), Japanese Yen (USD/JPY), Swiss Franc (USD/CHF), Gold (XAU/USD), Crude Oil (WTI), Bitcoin (BTC/USD), S&P 500 (SPX500), Nasdaq (NDX), and Dow Jones (DJI). These are the levels that matter on the technical charts into the weekly open. The assets are chaptered on the recording for your convenience.
US Dollar Index Price Chart – USD 240min
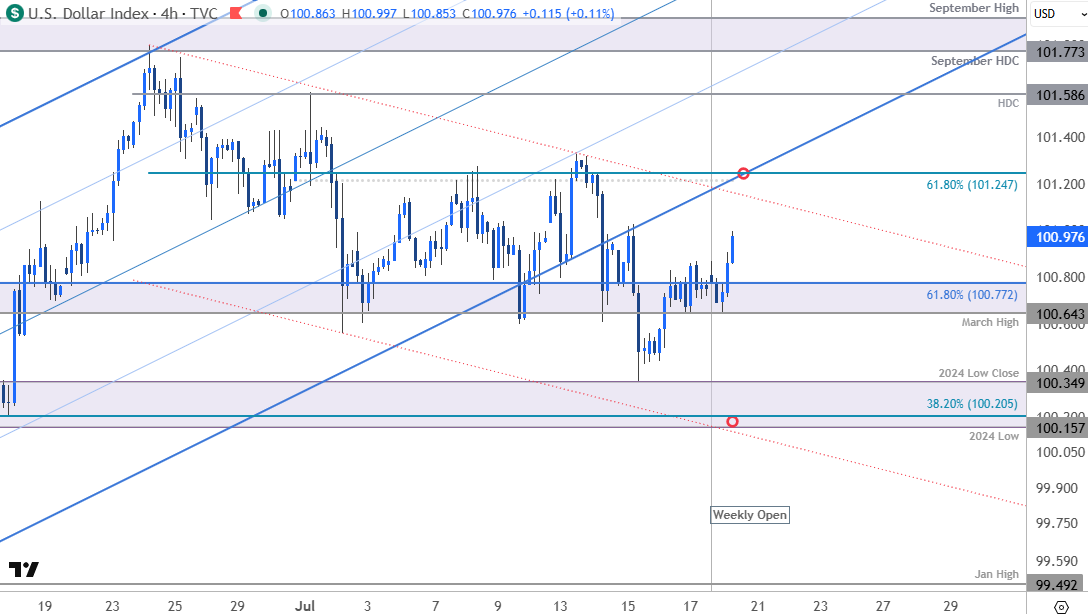
Chart Prepared by Michael Boutros, Sr. Technical Strategist; DXY on TradingView
Notes: The U.S. Dollar Index rebounded off pivotal support last week kat 100.16/35- a region defined by the 2024 low, the 38.2% retracement of the May rally, and the 2024 low close. The recovery is now approaching near-term downtrend resistance at the monthly open and the 61.8% retracement of the decline from the yearly high at 101.21/25. A topside breach / daily close above this threshold is needed to invalidate the late-June downtrend and threaten resumption of the broader May advance. Subsequent resistance eyed at the yearly high-day close (HDC) at 101.59 and the September 2024 high / high-day close (HDC) at 101.77/92.
Initial support rests with the March high and the 61.8% extension of the January advance at 100.64/77 with a break / close below 100.16 needed to suggest a more significant high was registered last month and a larger correction is underway. Such a scenario would expose initial support objectives at the January high at 99.49 and the 61.8% retracement of the May advance at 99.22.
Bottom line: The dollar recovery is now approaching confluent downtrend resistance around the monthly open. From a trading standpoint, look to reduce portions of long-exposure / raise protective stops a rally towards channel resistance - losses would need to be limited to 100.16 IF price is heading higher on this stretch with a close above 101.21/25 needed to fuel the next leg of the advance. Keep in mind this week begins the Fed blackout period ahead of next week’s highly anticipated FOMC rate decision.

Australian Dollar Price Chart – AUD/USD 240min
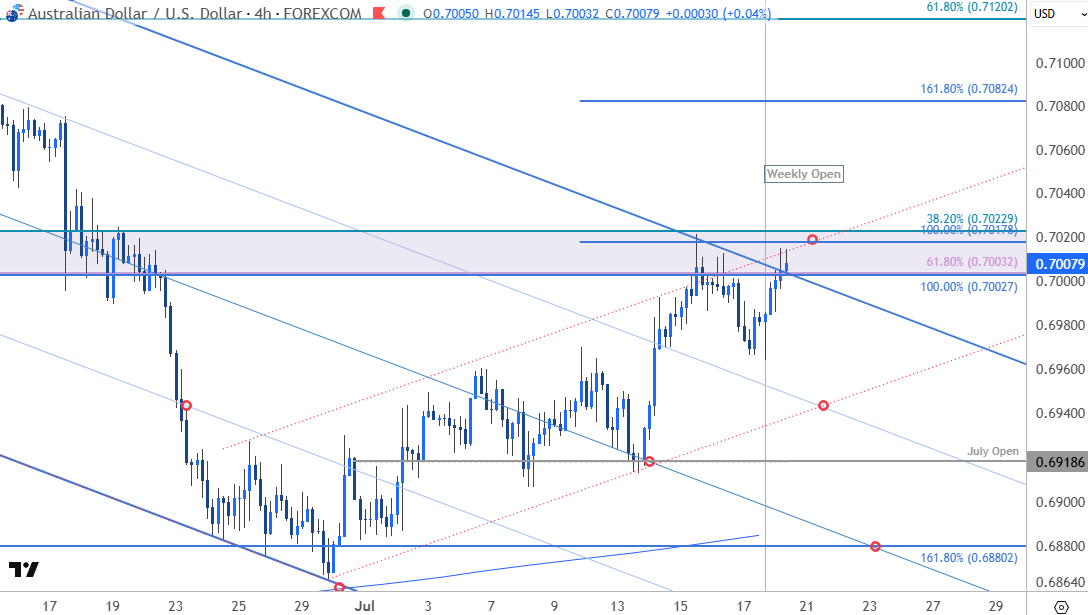
Chart Prepared by Michael Boutros, Sr. Technical Strategist; AUD/USD on TradingView
Notes: AUD/USD is testing critical resistance into the start of the week at 7003/23- a region defined by the 100% extension & the 38.2% retracement of the May decline, the 61.8% retracement of the March rally, and the 100% extension of the late-June rally. Note that the May downtrend and near-term uptrend resistance converge on this zone and a breach / daily close above would be needed to suggest a more significant low was registered last month and threaten resumption of the broader uptrend.
Initial support rests at the highlighted trendline confluence near ~6945 backed by the July open at 6919. Losses below this threshold would threaten downtrend resumption towards key support at 6880/87- look for a larger reaction there IF reached.
A topside breach / daily close above this key pivot zone would threaten another bout of accelerated Aussie gains with subsequent resistance objectives eyed at the 1.618% extension at 7082 and the 61.8% retracement at 7120.
Bottom line: The immediate focus is on a reaction off this pivotal resistance zone with the July uptrend vulnerable while below 7023. From a trading standpoint, losses would need to be limited to 6919 IF Aussie is heading higher on this stretch with a breach / close above the upper parallel needed to fuel the next leg of the rally.
Economic Calendar – Key Data Releases
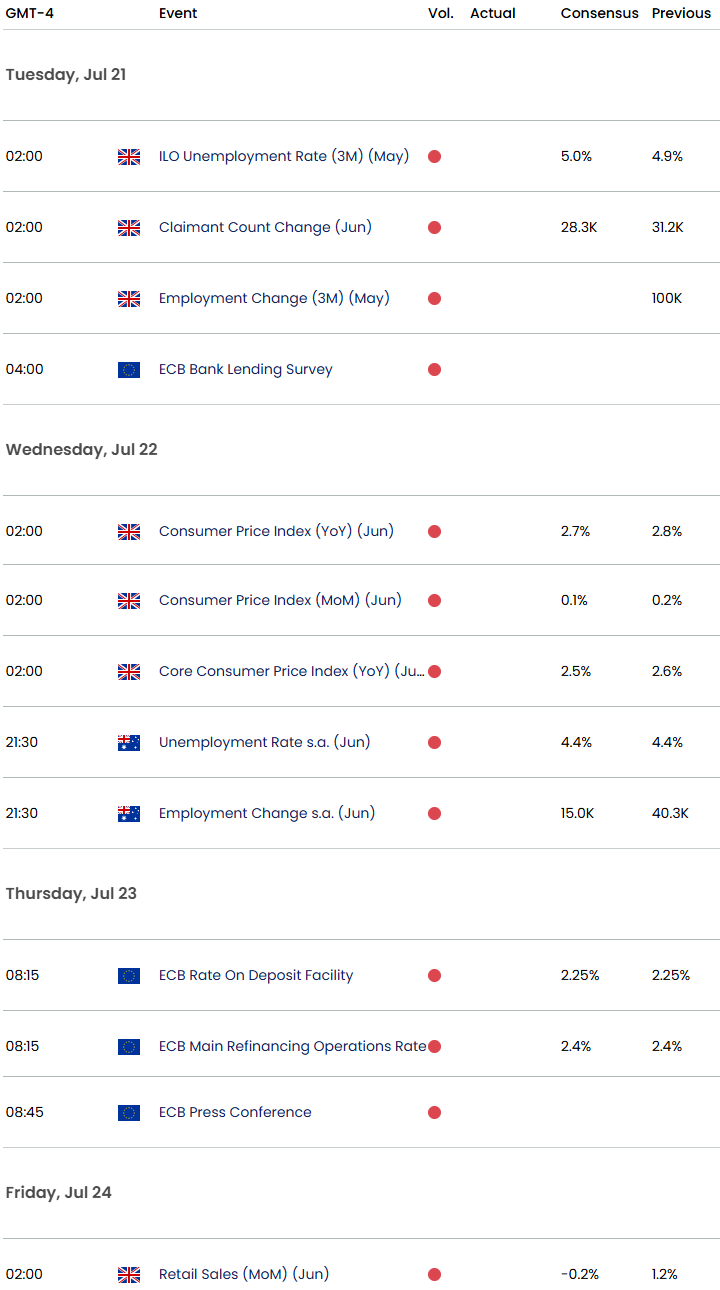
Economic Calendar - latest economic developments and upcoming event risk.
--- Written by Michael Boutros, Senior Technical Strategist
Follow Michael on X @MBForex


Open an account in minutes
Experience award-winning platforms with fast and secure execution.
Economic calendar
Web Trader platform
Our sophisticated web-based platform is packed with features.
Related articles
China's steel slump leaves iron ore bulls under the pump
Iron ore has broken major support, threatening a return to the lows of 2022 as mounting evidence of weakness in China's steel sector reinforces the bearish outlook.

NZD/USD Forecast: Kiwi faces historic breakdown as RBNZ survey looms
NZD/USD is teetering above support that held through the pandemic and Liberation Day turmoil. With RBNZ hawks repeatedly disappointed, today's inflation expectations survey could open the door to a slide towards the GFC lows.

USD/JPY, AUD/JPY: Central Bank Divergence Creates Two-Way Risk
USD/JPY eyes a breakout above 160, while AUD/JPY faces further losses as Fed, RBA and BoJ interest rate expectations diverge.

The information on this web site is not targeted at the general public of any particular country. It is not intended for distribution to residents in any country where such distribution or use would contravene any local law or regulatory requirement. The information and opinions in this report are for general information use only and are not intended as an offer or solicitation with respect to the purchase or sale of any currency or CFD contract. All opinions and information contained in this report are subject to change without notice. This report has been prepared without regard to the specific investment objectives, financial situation and needs of any particular recipient. Any references to historical price movements or levels is informational based on our analysis and we do not represent or warranty that any such movements or levels are likely to reoccur in the future. While the information contained herein was obtained from sources believed to be reliable, author does not guarantee its accuracy or completeness, nor does author assume any liability for any direct, indirect or consequential loss that may result from the reliance by any person upon any such information or opinions.
Futures, Options on Futures, Foreign Exchange and other leveraged products involves significant risk of loss and is not suitable for all investors. Losses can exceed your deposits. Increasing leverage increases risk. Spot Gold and Silver contracts are not subject to regulation under the U.S. Commodity Exchange Act. Contracts for Difference (CFDs) are not available for US residents. Before deciding to trade forex, commodity futures, or digital assets, you should carefully consider your financial objectives, level of experience and risk appetite. Any opinions, news, research, analyses, prices or other information contained herein is intended as general information about the subject matter covered and is provided with the understanding that we do not provide any investment, legal, or tax advice. You should consult with appropriate counsel or other advisors on all investment, legal, or tax matters. References to FOREX.com or GAIN Capital refer to StoneX Group Inc. and its subsidiaries. Please read Characteristics and Risks of Standardized Options.