EUR/USD Talking Points:
- The US Dollar is overbought and EUR/USD is oversold, and while those markers don’t demand definite reversal, it does raise the stakes for continuation.
- So far, buyers have only been able to pose a minor bounce and as looked at in the webinar yesterday, there’s not yet evidence that there’s enough motivation to produce a reversal move.
I looked into this coming into the week, highlighting EUR/USD in the top five charts for the week ahead, and that theme remains of interest as the pair has pushed down to a fresh yearly low.
In yesterday’s webinar, there was a bounce in-play but as I said then, there wasn’t yet enough evidence to substantiate whether that bounce was just an oversold pullback or the start of something larger. At this stage, it seems it was more of the former than the latter, but there’s still potential given that price hasn’t yet taken out the Monday low.
For that to work and for a bounce to set up in the back-half of the week, bulls will need to show up and hold the low above 1.1161, which, so far, they have by 3.4 pips.
EUR/USD 30-Minute Chart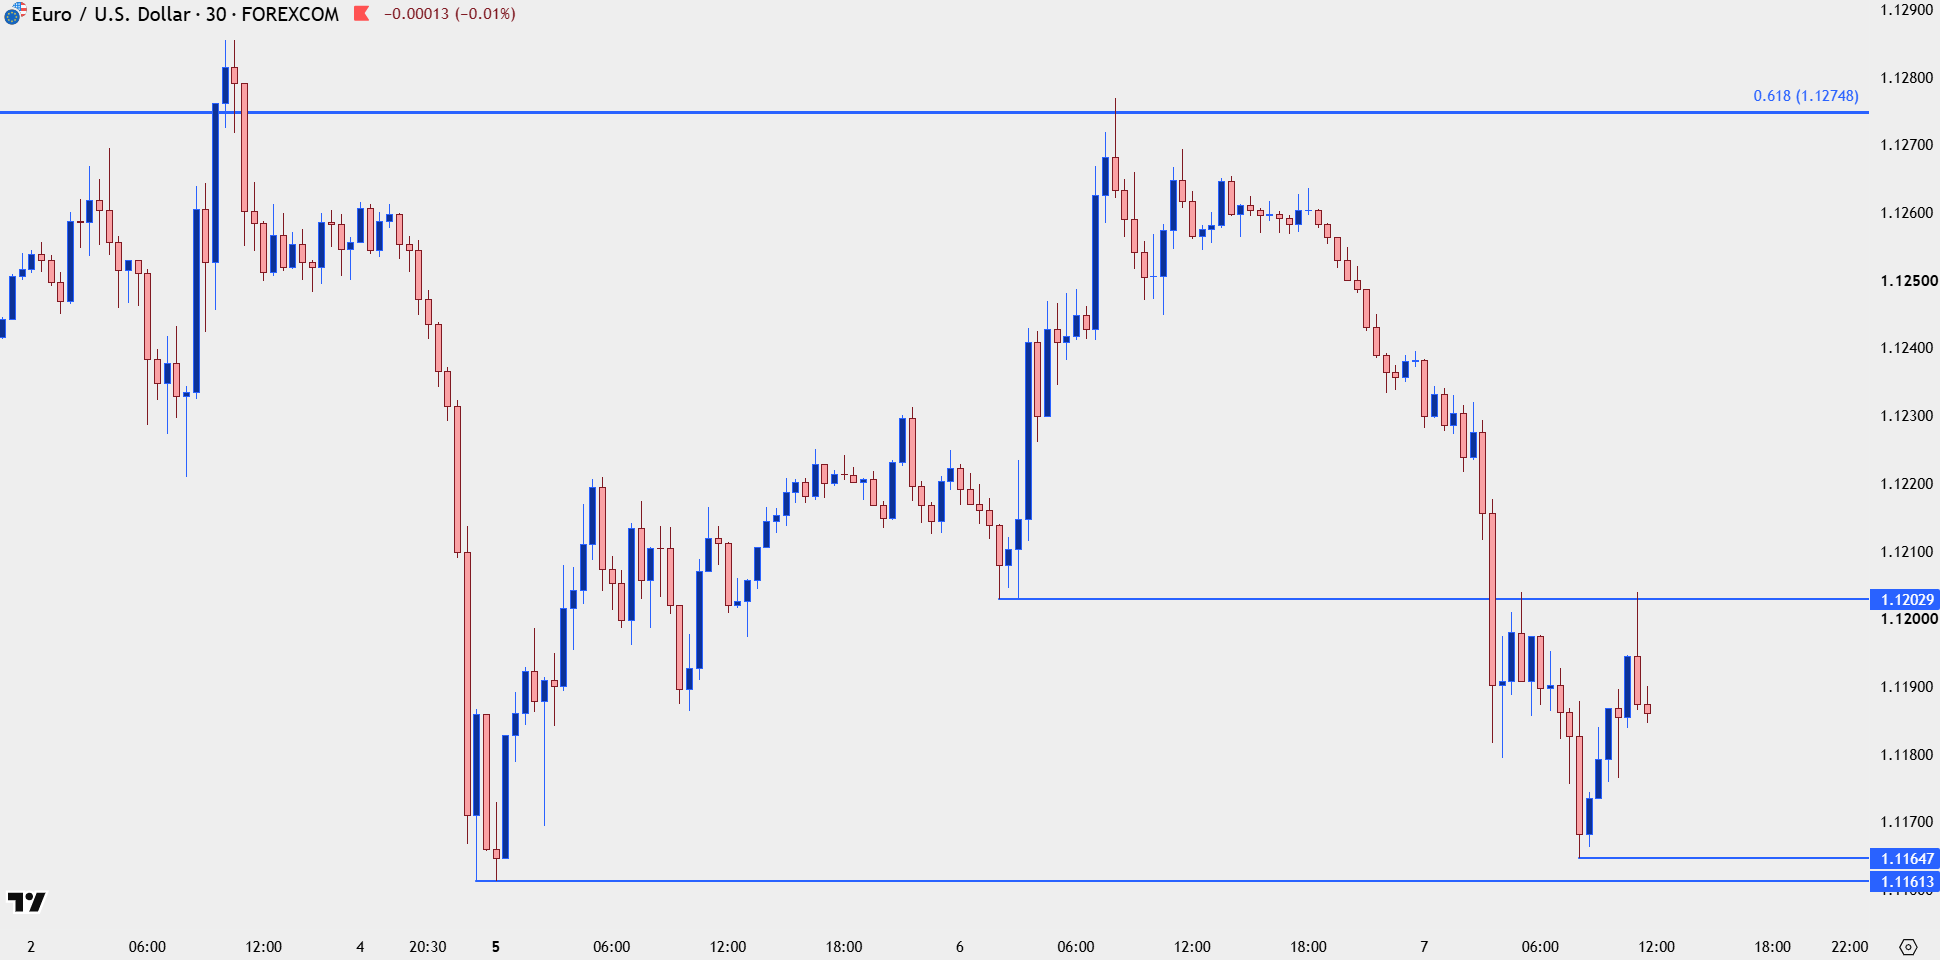
Chart prepared by James Stanley; data derived from Tradingview
EUR/USD Most Oversold in a Decade
As I often say in webinars, RSI isn’t a great timing indicator as a market can often get more oversold or overbought. And any oscillator, RSI included, is a lagging indicator on an already lagging variable (price), so it’s a bit like looking at the world through rose-colored glasses.
This isn’t to say that the indicator is completely worthless, however, as it can provide some good information. And perhaps more important than using it to get into trades is using it to stay out of markets in an extreme state of stress.
At a close below 20 last week, EUR/USD was more oversold than it had been since 2015. That prior instance was an extreme period of stress, but the sub-20 RSI read showed around a significant low, after which the pair was rangebound for much of the next two years.
EUR/USD Daily Chart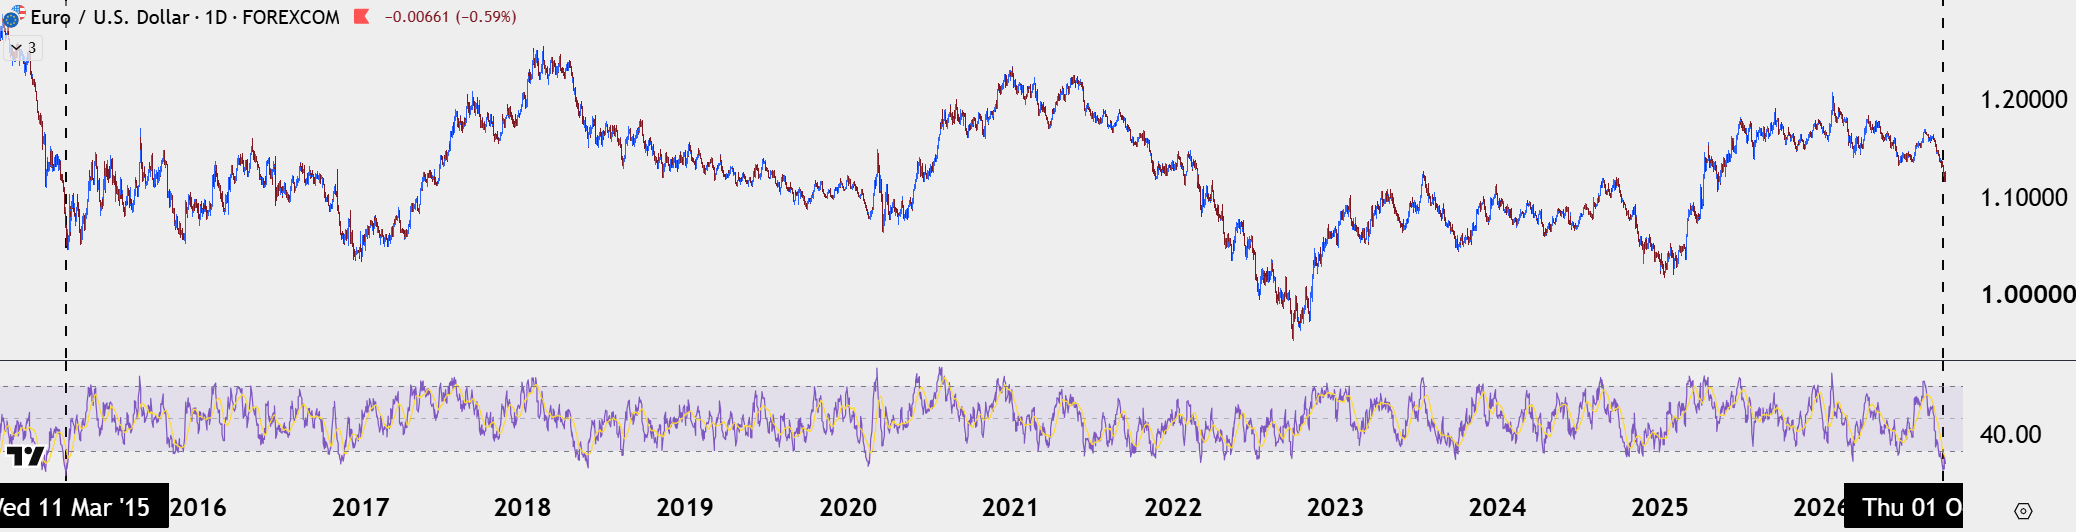
Chart prepared by James Stanley; data derived from Tradingview
EUR/USD with Perspective
The daily chart highlights the theme well and RSI remains in oversold territory. But, given the prior element of divergence with the Monday low in price producing a higher-low via RSI, it illustrates just how stretched the move has become.
This is a deduction, however, and not quite a thesis that builds into a bullish backdrop: It simply sets the stage for which buyers can make a move and, at this point it’s still quite early to forecast a trend change.
There is, however, the possibility for reversal strategies if (and it’s a big ‘if’) that low can hold on the above shorter-term chart.
EUR/USD Daily Chart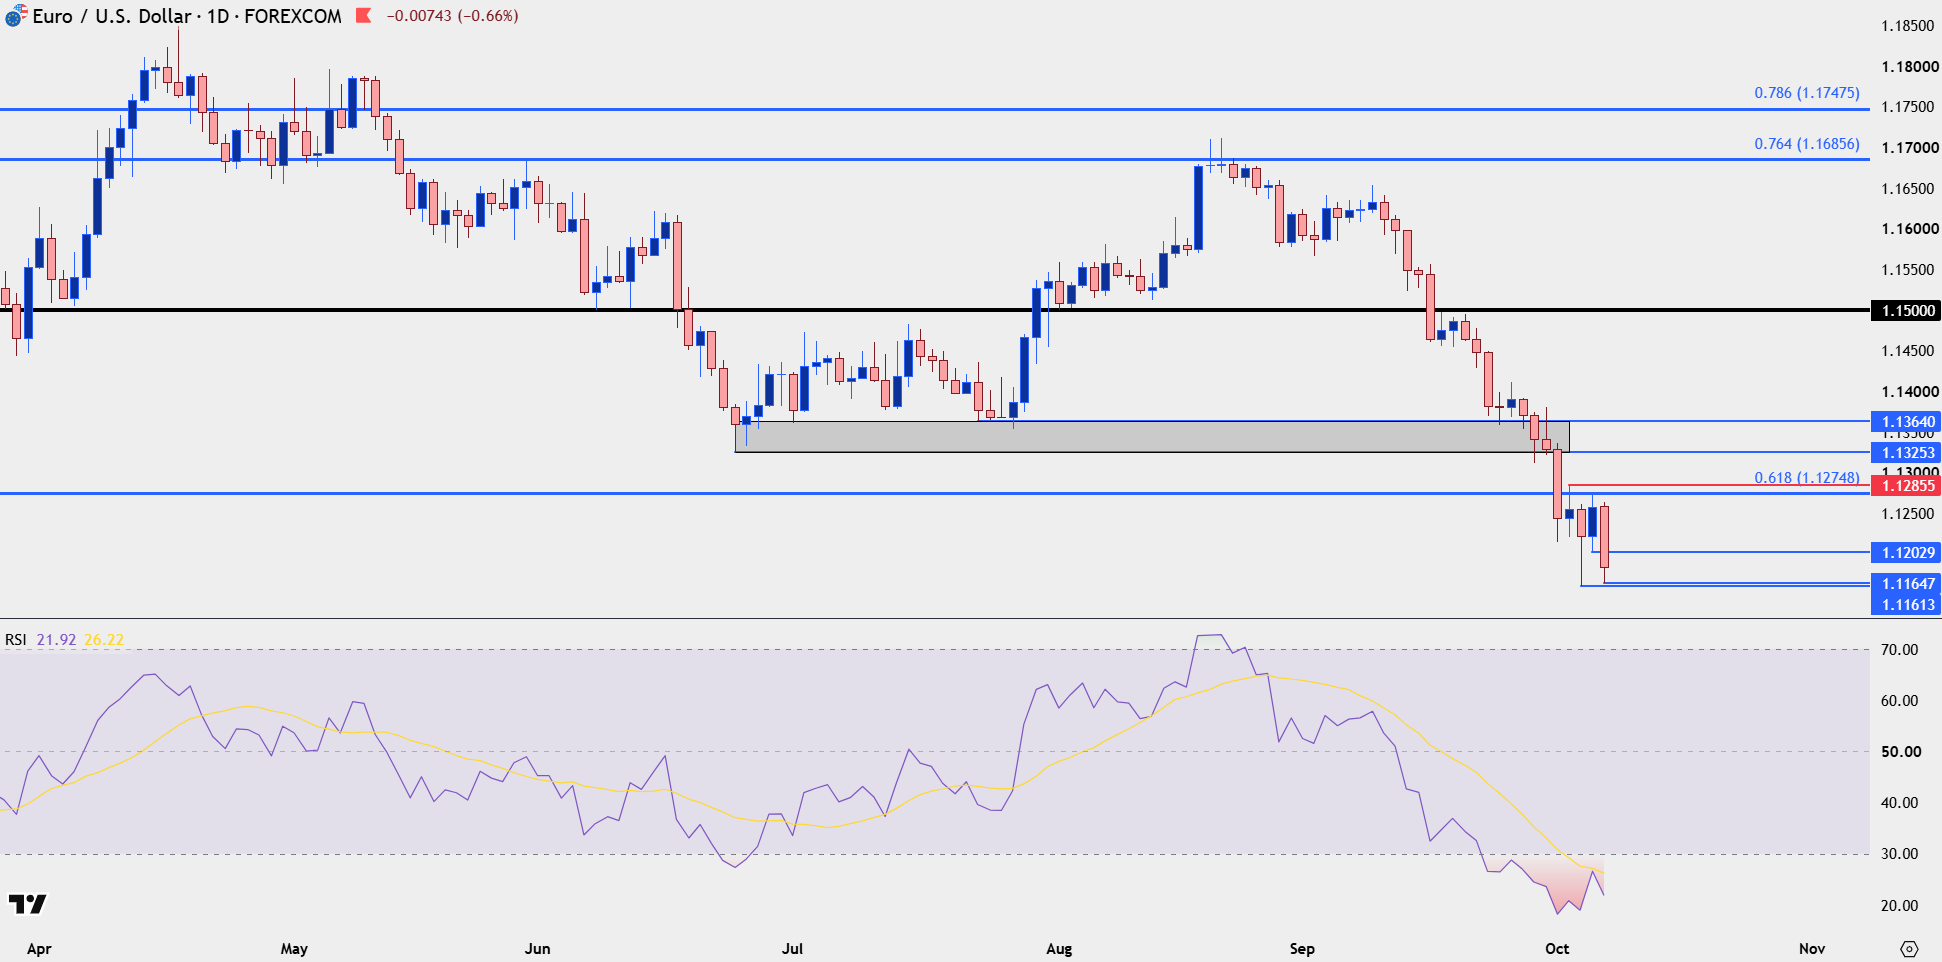
Chart prepared by James Stanley; data derived from Tradingview
--- written by James Stanley, Senior Market Analyst, Global Macro