
Over recent trading sessions, the British pound has begun to show a notable recovery. This can be observed in the performance of GBP/USD, which has gained more than 1.3% over the last four sessions, reflecting a consistent improvement in sterling's strength against the U.S. dollar.
For now, this buying pressure is largely being driven by UK employment data that has reinforced expectations of a potentially more aggressive Bank of England over the coming months. This comes at a time when the U.S. dollar has also been experiencing a period of relative weakness, a combination that is helping the pound recover some of the ground lost in recent months. As long as these factors remain in place, buying pressure around GBP/USD could continue to be relevant in the coming sessions.

How Are Employment Data Affecting the Market?
On October 20, the United Kingdom released its unemployment rate for the June-August 2026 rolling period. The figures surprised to the upside, with unemployment falling to 4.7%, below the 4.9% expected by the market and marking the lowest unemployment rate recorded throughout 2026.
This remains important because it highlights the resilience of the UK labor market despite the current macroeconomic environment. A relatively strong employment backdrop often gives the central bank greater flexibility to maintain a restrictive monetary policy stance, particularly while inflation remains a key concern for the economy.
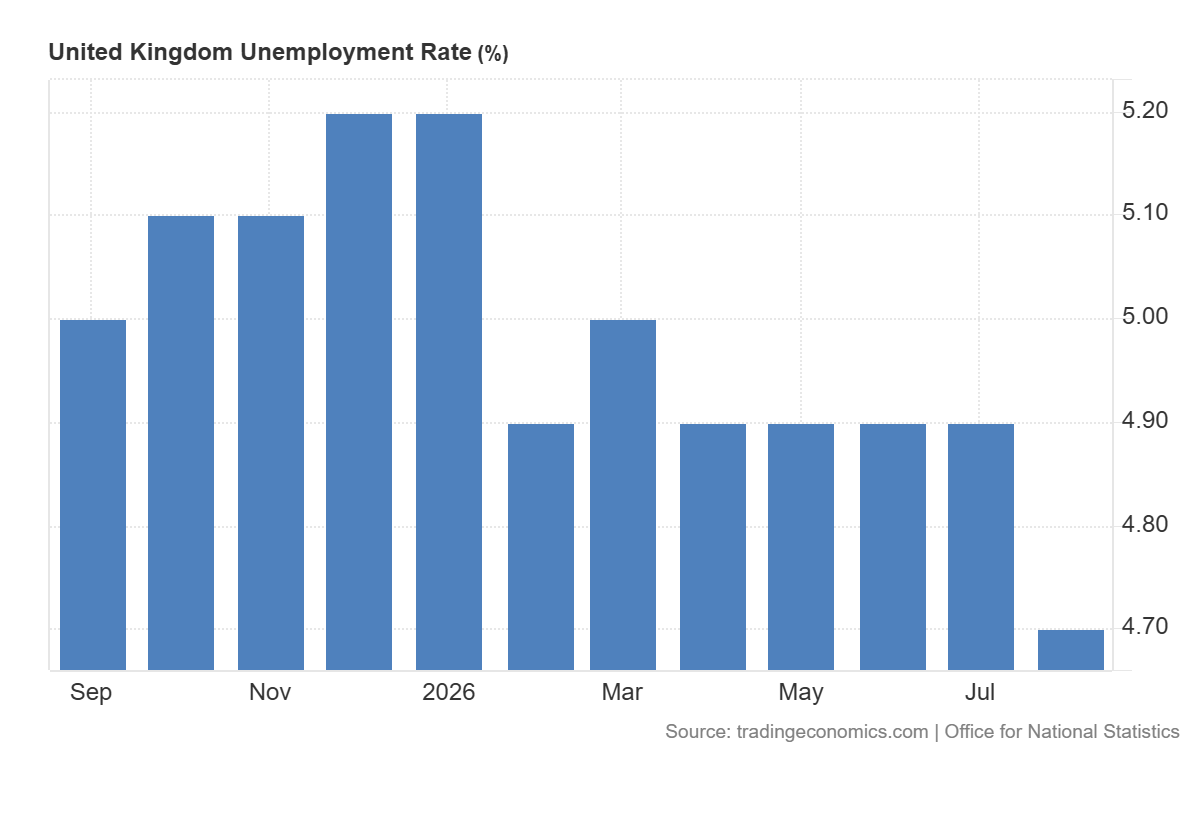
Source: TradingEconomics
The impact of these figures has already started to appear in market expectations for UK monetary policy. Current pricing for the November 5, 2026 meeting implies more than an 85% probability that the Bank of England will raise its benchmark rate from the current 3.75% to 4.00%.
This is significant because it suggests that markets are now pricing in a more aggressive Bank of England than they were only a few weeks ago, a dynamic that could increasingly differentiate the UK from other major central banks, including the Federal Reserve.
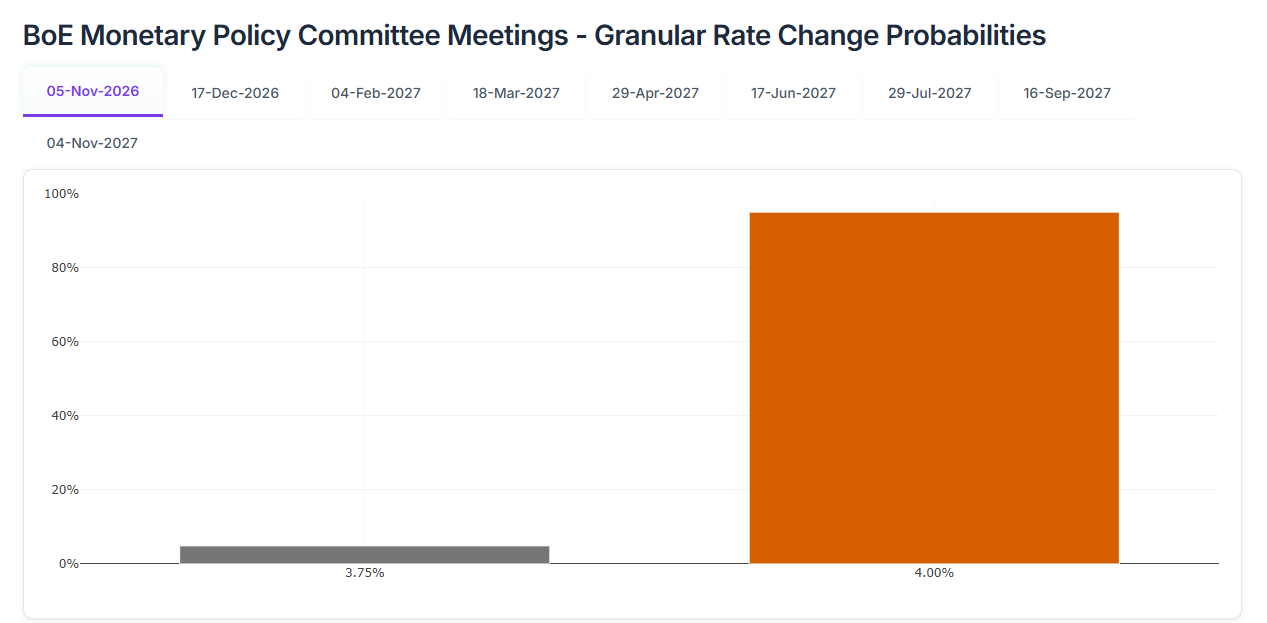
Source: Centralbankwatch
These expectations have also had an impact on the UK bond market. 10-year UK gilt yields continue to trade near recent highs around 5.4%, reflecting notable resilience following the employment release.
What stands out is that while UK yields remain firm, U.S. Treasury yields continue to show signs of moderation. U.S. 10-year yields are currently trading near 5.1%, slightly widening the yield differential in favor of the United Kingdom. This dynamic could begin to support sterling-denominated investments and increase the relative appeal of UK financial assets compared to their U.S. counterparts.
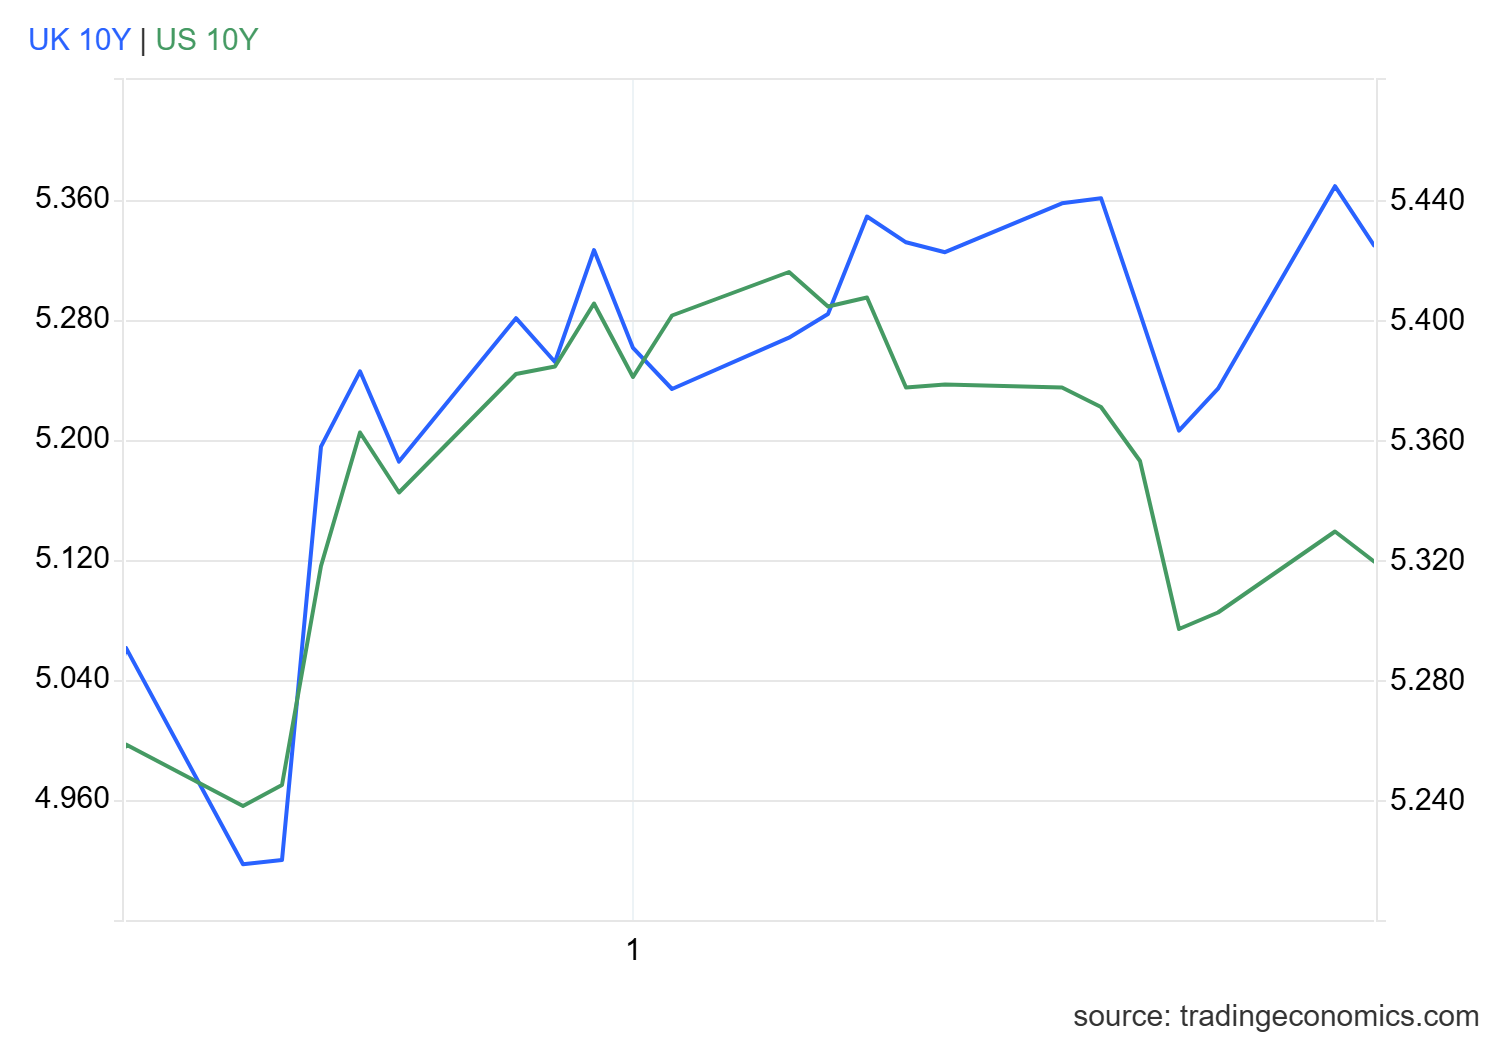
Source: TradingEconomics
With all of this in mind, the latest labor market data have reinforced perceptions of stability within the UK economy while strengthening expectations of a more restrictive monetary policy stance. Combined with the recent weakness in the U.S. dollar, this environment is helping the pound continue to recover ground in the short term. If these conditions remain in place, buying pressure on GBP/USD could continue to be a relevant feature of the market over the coming sessions.
GBP/USD Technical Forecast
Source: StoneX, Tradingview
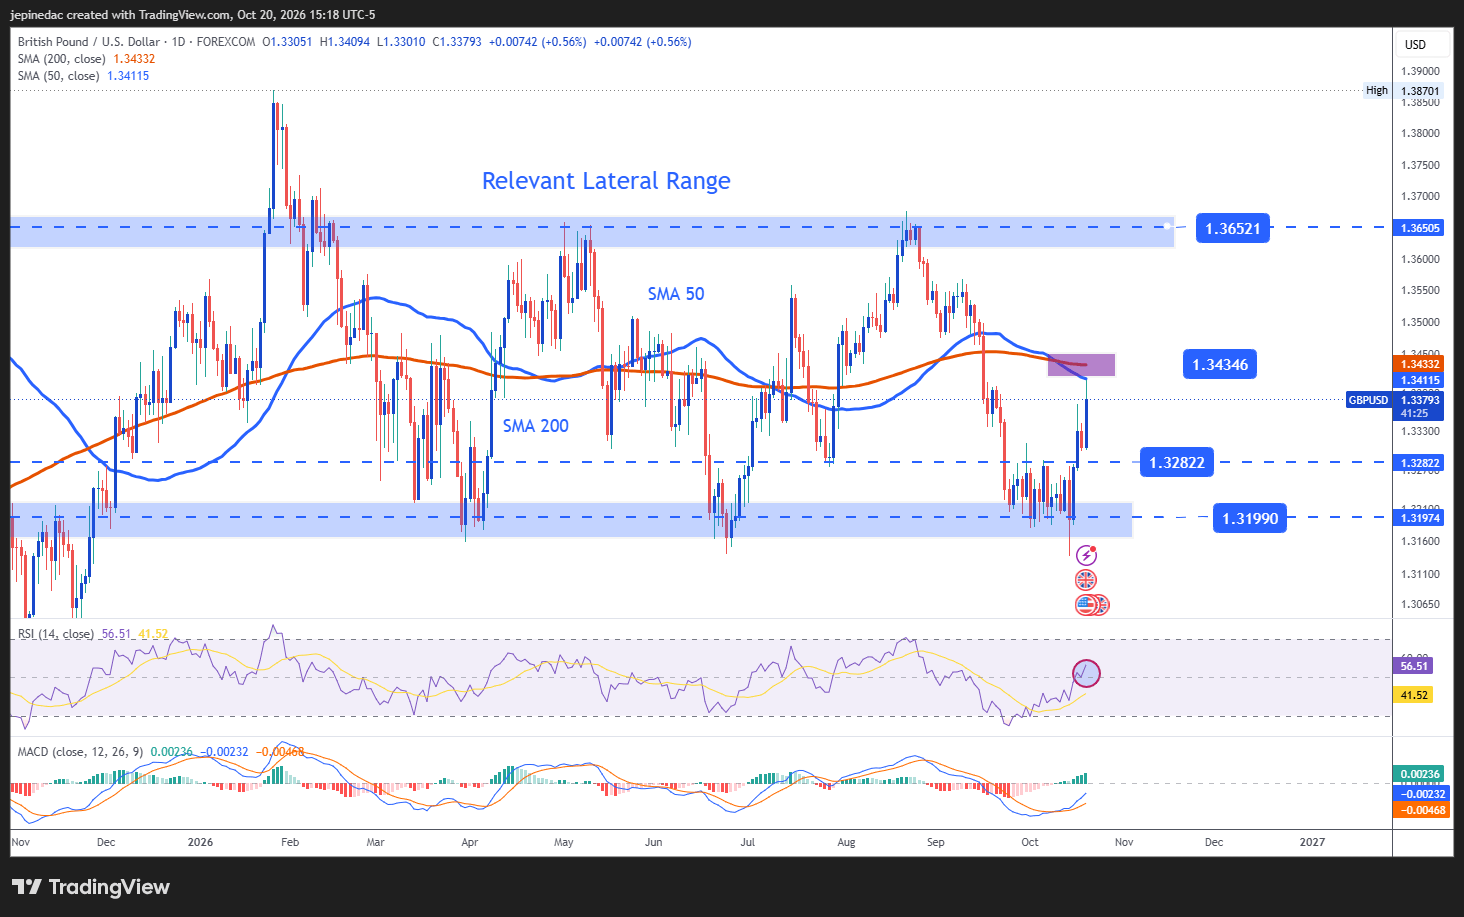
- The broader trading range remains relevant: Although GBP/USD has posted a consistent recovery in recent sessions, the move is not yet strong enough to confirm the emergence of a new bullish trend on the daily chart. For now, price action remains trapped within the broad trading range that has dominated the pair's behavior for much of the past several months. Unless key resistance levels are broken, it remains difficult to argue for a more established bullish structure.
- MACD: The MACD histogram continues to develop above the 0 neutral line, reflecting a consistent improvement in short-term moving-average momentum. This reading supports the possibility that the bullish bias could remain relevant in the sessions ahead.
- RSI: A similar picture can be observed in the RSI, which remains above the 50 neutral level. This reading suggests that buying momentum continues to gain traction and supports the view that the recent recovery may retain relevance in the short term.
Key Levels:
- 1.34346 – Key Resistance: An important resistance area that coincides with the 50-period and 200-period simple moving averages. A sustained move above this level could alter the current market structure and open the door to a more established bullish trend over the coming weeks.
- 1.32822 – Near-Term Barrier: A level that aligns with an important retracement zone observed in recent weeks and could become the main reference to monitor in the event of short-term bearish corrections.
- 1.31990 – Major Support: A significant support zone that has been widely respected throughout much of 2026 and remains the most important downside barrier on the chart. A break below this area could bring an end to the long-standing trading range and open the door to a more structured bearish trend over the longer term.
Written by Julian Pineda, CFA, CMT – Market Analyst
Follow him on: @julianpineda25