



The weekend headlines continue to rock markets as another gap-up in oil drove reverberations across the macro space. Stocks sold off and the USD rallied, at least initially, as tensions flared from the Strait of Hormuz. There was also a bit of confusion as President Trump announced a postponement of strikes on Iranian energy infrastructure, which was then refuted by Iranian sources. But, given the trajectory of markets with a continued recovery it seems that the bias remains on President Trump’s remarks although we’re still at an early stage of the matter.
In gold, a painful finish to last week led to a painful start of this one, as prices continued their descent following a sell-off of more than 10% from Wednesday through Friday. The selling this morning stalled just above the 200 day moving average, which was confluent with the $4100 level, and that has so far led to a vigorous bounce showing an extended underside wick on the daily chart.
Gold Daily Chart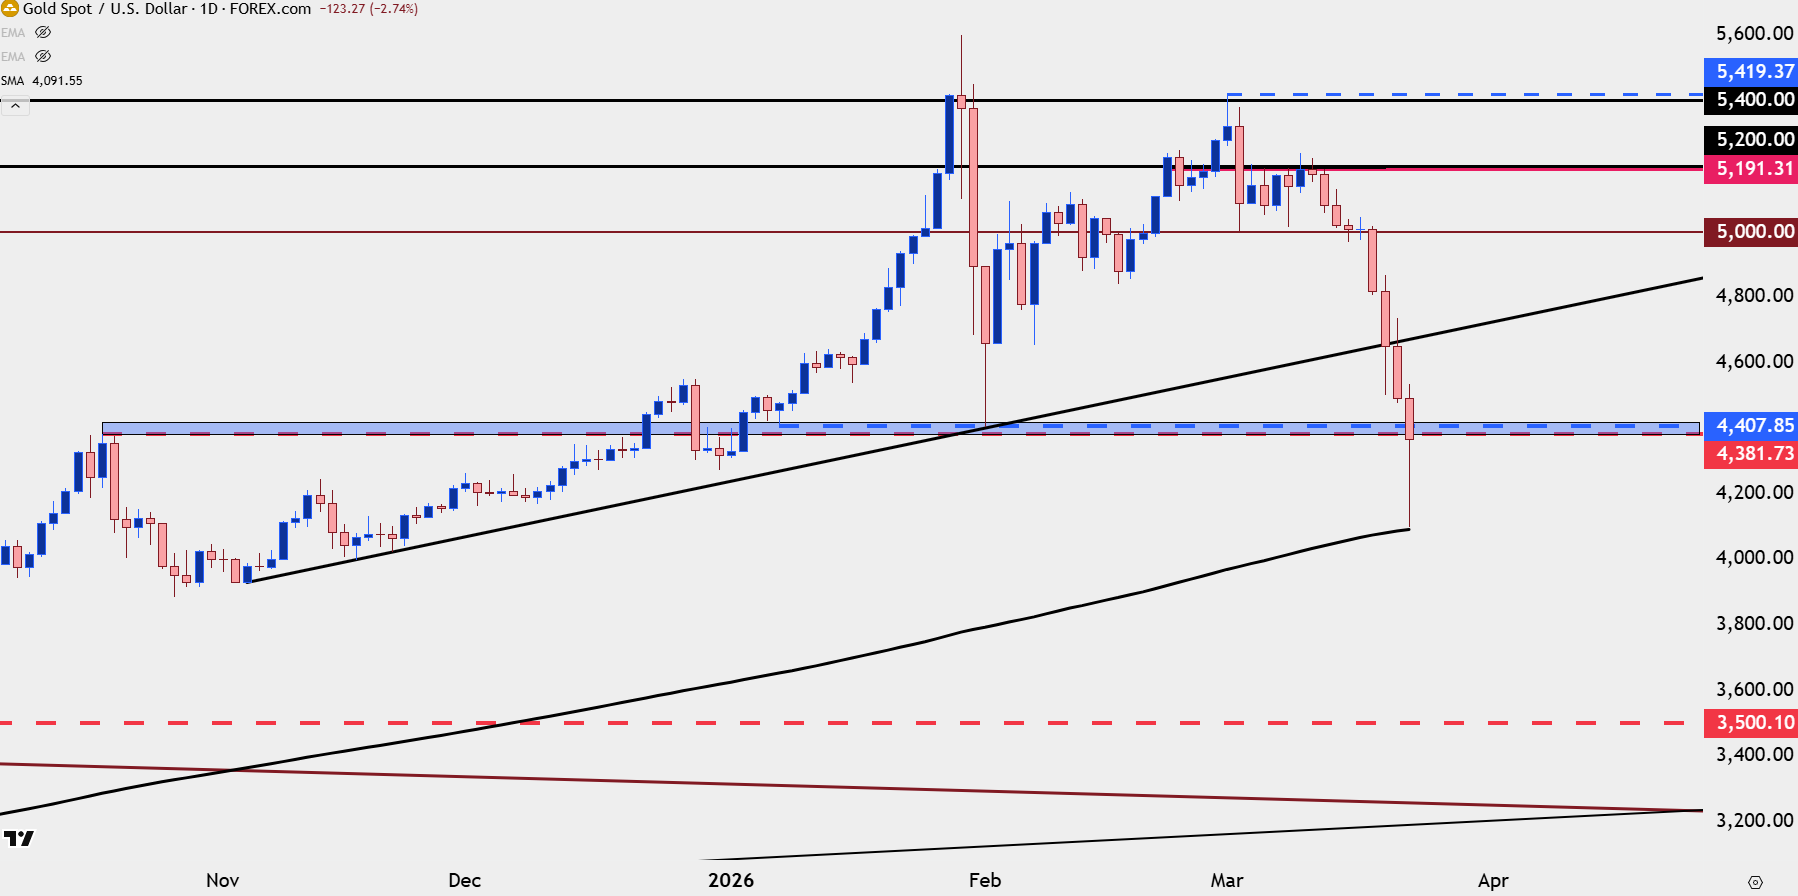
Chart prepared by James Stanley; data derived from Tradingview
Gold Resistance
From the above chart you can see that the zone around the $4400 level has been a contentious area, as this caught the highs back in October before setting support in early-February.
And now, shorter-term it’s the $4500 level that’s coming into play as resistance from prior support.
The challenge at this point is just how volatile matters have been and there’s no clear indication that any end is in sight. So, traders should expect that volatility to continue and along with it, a more difficult challenge in riding longer-term trends.
With that said, there has been structure in the recent waves, even with the extreme volatility. The below chart marks psychological levels at each $100 increment and notice how the $4100 support hit, illustrated by the wide underside wick, led to a rally up to resistance at prior support of $4500. And this then sets up support at $4300 which was prior short-term resistance.
Gold Hourly Chart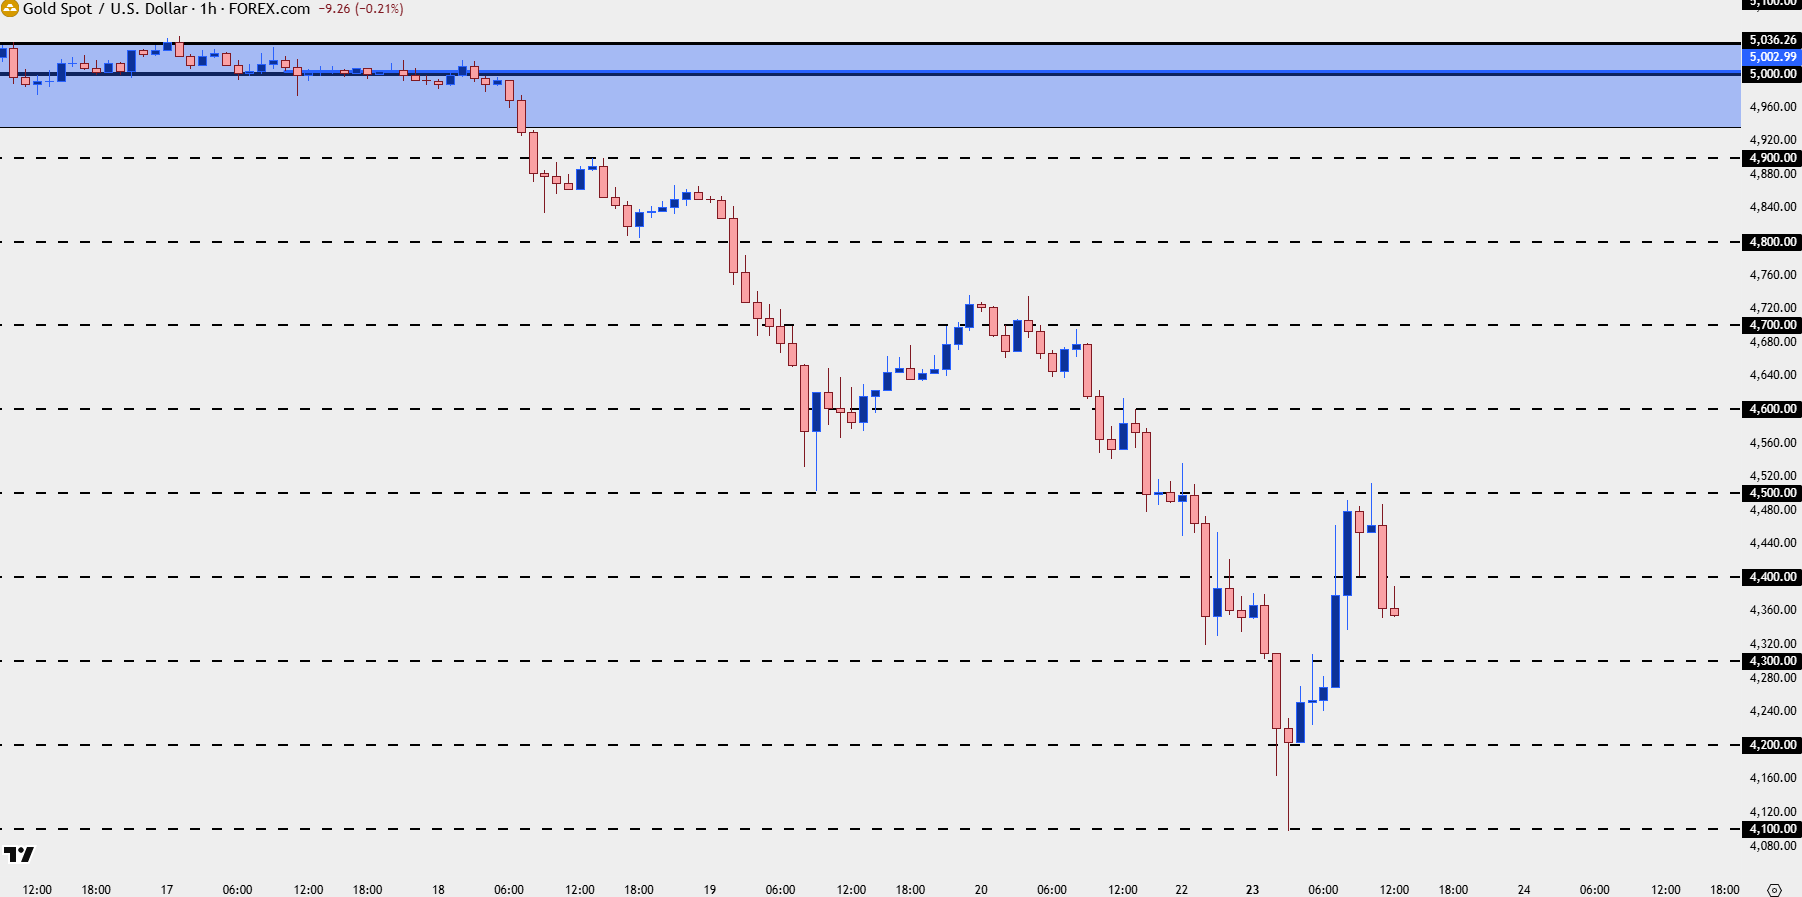
Chart prepared by James Stanley; data derived from Tradingview
Don’t Expect it to be Easy but Try to Keep it Simple
Higher levels of volatility, while both interesting and exciting, can also make instituting trading strategy even more difficult as the higher volatility simply means a wider range of possible outcomes, and that often means lower winning percentages (or expectations of winning percentage).
Like we saw this morning, those breakout trades can quickly snap back and what was a wining position can soon turn into a losing one, and then perhaps more frustrating is the fact that traders looking to ride the momentum now are faced with the decision of how and where to cut the bleeding.
Traders should expect high volatility to continue because even if it doesn’t, at the very least they’re prepared. Lower winning percentages or expectations of lower winning percentages need to be offset by larger reward-to-risk ratios, and that’s the true luxury of higher levels of volatility. As a case in point, that bounce from $4100 this morning ran by almost 10% on the rally up to $4500, and this was a mere pullback in a broader move. If those that had chased the short-side breakout at $4200 or $4300, that’s painful, so it’s important to go into every trade with a plan for where to get out in both winning and losing scenarios.
As for simplicity, going in with low expectations for catching a move but a pre-planned exit strategy for both stops and limits can be key to reinforcing strategy, rather than allowing emotional decision making driven by higher levels of volatility to drive the trader into decisions that they otherwise would not have wanted to make.
One way to try to keep some perspective is analysis of charts like the four-hour or daily, where extended wicks highlight reactions and those reactions are themes that may continue, with the $4100 bounce from this morning as a case in point and currently, the $4500 response at resistance. A grouping of wicks, such as we saw at $4700, highlights continued defense from buyers or sellers and that took can be seen as reactionary.
Gold Four-Hour Chart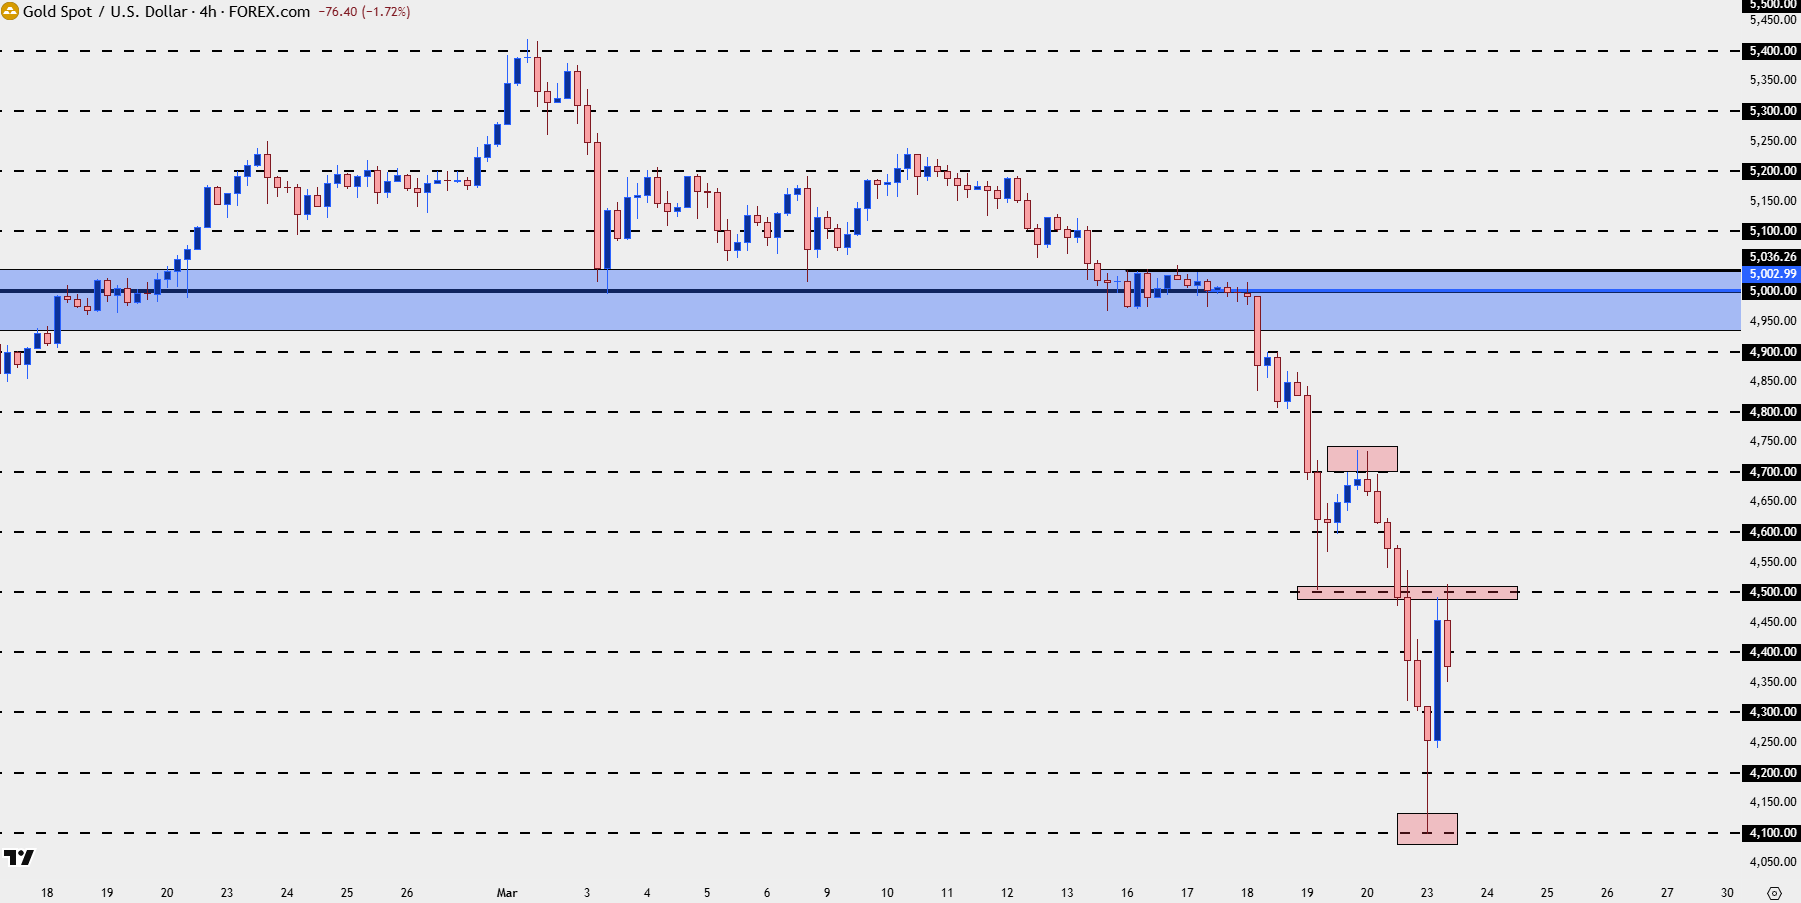
Chart prepared by James Stanley; data derived from Tradingview
--- written by James Stanley, Senior Market Analyst, Global Macro






