



Gold Volatility Perks Up At $4k, Though Pullbacks Could Be Limited
Gold’s meteoric rise above $4,000 has drawn traders’ attention, with volatility picking up sharply at record highs. Yet with sentiment and positioning still far from extreme, any correction could prove shallow as dip buyers re-emerge.
Share this:

Gold’s meteoric rise to $4,000 has been well documented, but volatility has finally returned near the highs — which could leave some traders hesitant to rejoin the trend immediately. That could translate into choppy price action around current levels before gold either retraces or resumes its advance.
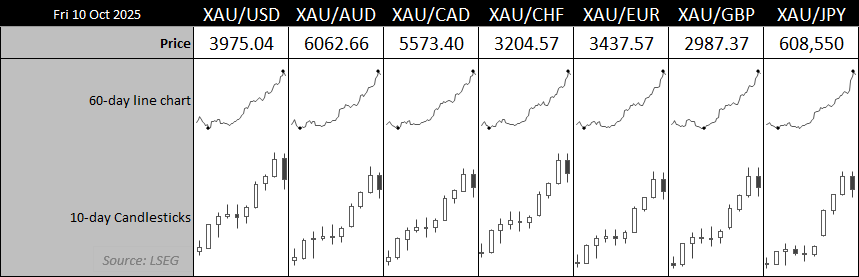
Chart analysis by Matt Simpson - Source: LSEG
View related analysis:
View related analysis:
Gold’s 60-day line charts against FX majors highlight how relentless the rally has been, with barely a pause or pullback on the daily timeframe. However, Thursday’s futures session against the US dollar stood out as the most volatile day in five months — and notably, the highest volume day in six — suggesting initiative selling rather than simple long liquidation. Moreover, with gold failing to close within its upper Keltner band for the past month, the case for a proper mean-reversion phase is strengthening.
Still, gold produced little in the way of a pullback after breaking above $3,000 for the first time in history back in January. It recorded only a single daily close below that level before the uptrend resumed, even staging a brief retest before bulls regained control. Unless momentum turns sharply lower, gold may remain vulnerable to dip buyers — or even see an extension of its rally.

Chart analysis by Matt Simpson - Source: COMEX, LSEG


Gold Futures Positioning (GC): Weekly COT Report Analysis
Futures traders are not positioned at a sentiment extreme on gold. While both large speculators and managed funds have steadily increased their net-long exposure since May, the pace has been measured — and positioning remains well below the extremes seen at previous price peaks. Gross shorts have ticked higher but remain relatively low, while gross longs have not reached levels that typically signal overcrowding.
Overall, market positioning remains supportive of gold prices, suggesting that any pullbacks could be shallow and continue to attract dip buyers.

Chart analysis by Matt Simpson – Source: COMEX, LSEG
Gold Futures (GC) Technical Analysis: 1-Hour Chart
Prices are a touch above $4k at the time of writing as it retraces some of Thursday’s selloff during thin Asian trade today. But I am inclined to suspect the near term top is in place and that bears could fade into moves towards Thursday’s high/ Note that the monthly R1 pivot is just above $4k which could help cap gains or help form a swing high in the area.
Should bears get their way, gold could retrace to the 10-day EMA (3930) or weekly VPOC at 3892. Should bearish momentum increase then a move to 3800 could be on the cards, just above the prior weekly VPOC and monthly pivot point. But as outlined above, I suspect the retracement could be limited, so these lower targets are not currently favoured unless we see a material change in sentiment against gold.
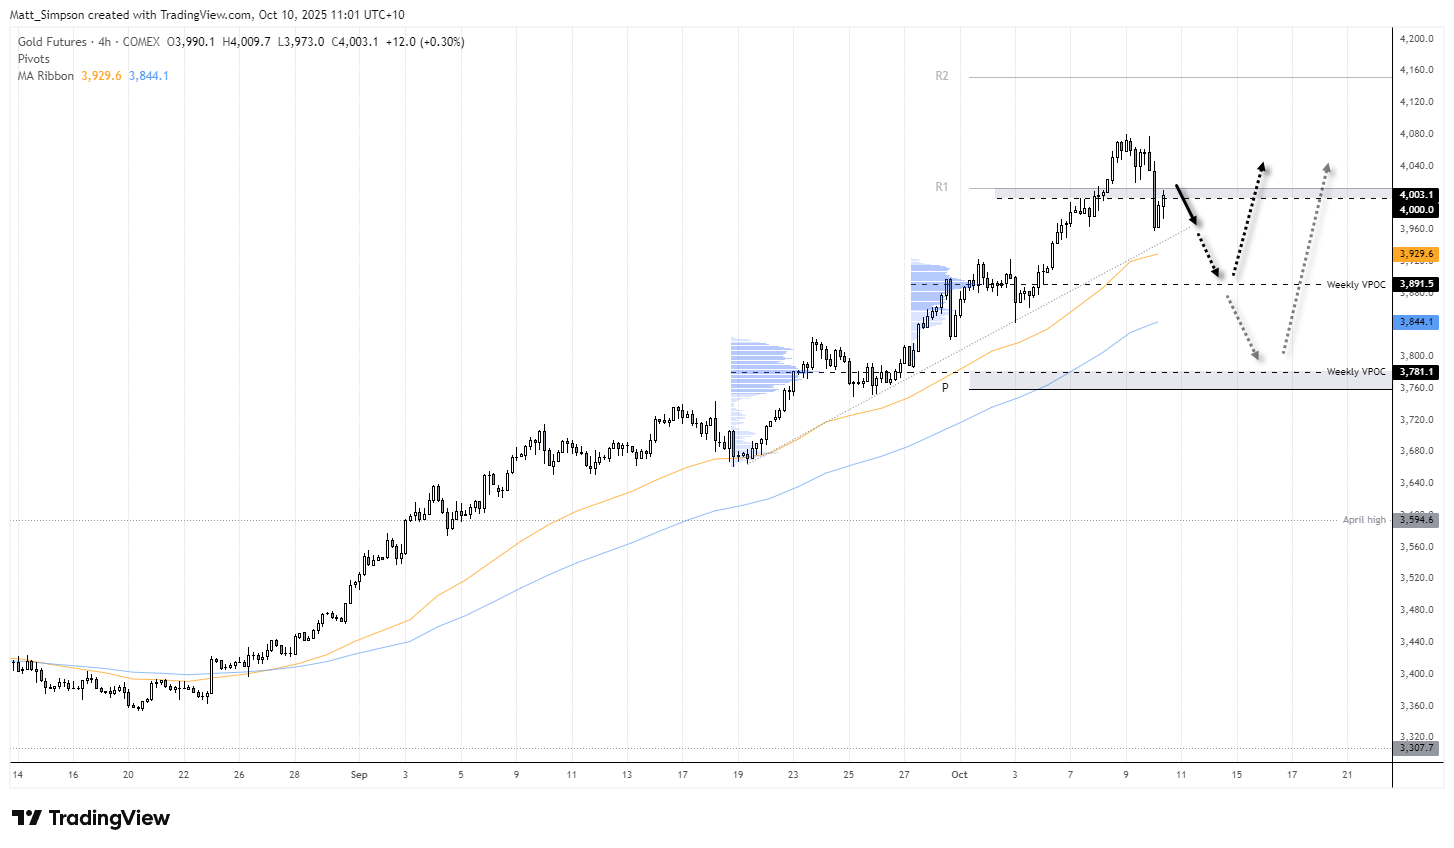
Chart analysis by Matt Simpson – Source: COMEX, LSEG
View the full economic calendar
View the full economic calendar
-- Written by Matt Simpson
Follow Matt on Twitter @cLeverEdge
How to trade with City Index
You can trade with City Index by following these four easy steps:
- Open an account, or log in if you’re already a customer
• Open an account in the UK
• Open an account in Australia
• Open an account in Singapore
- Search for the market you want to trade in our award-winning platform
- Choose your position and size, and your stop and limit levels
- Place the trade
Related tags:
Latest market news




Open an account in minutes
Experience award-winning platforms with fast and secure execution.
Economic calendar
Web Trader platform
Our sophisticated web-based platform is packed with features.
Related articles

Gold outlook: seasonal tailwind offers hope with XAU/USD below $4,000
A historically stronger seasonal window and steady central bank buying are offering gold some hope after its slide to a fresh 2026 low. Reclaiming the 4,000 mark is the first sign that the metal may have found a floor.


Bitcoin, Gold Outlook: Bullish Hold or Bearish Shift?
Bitcoin, Gold Outlook: The dollar’s surge to new 2026 highs and approach toward nine-month resistance are raising near-term reversal risks across precious metals and currency markets. This follows recent declines that pushed Bitcoin below $70,000 and gold below $3,870.


Gold, EUR/USD hit 2026 lows as US yields erupt
US Treasury yields have staged one of their largest four-session increases in decades, hammering EUR/USD and gold. But while the euro's decline makes sense, gold's reaction has been extraordinary.

The information on this web site is not targeted at the general public of any particular country. It is not intended for distribution to residents in any country where such distribution or use would contravene any local law or regulatory requirement. The information and opinions in this report are for general information use only and are not intended as an offer or solicitation with respect to the purchase or sale of any currency or CFD contract. All opinions and information contained in this report are subject to change without notice. This report has been prepared without regard to the specific investment objectives, financial situation and needs of any particular recipient. Any references to historical price movements or levels is informational based on our analysis and we do not represent or warranty that any such movements or levels are likely to reoccur in the future. While the information contained herein was obtained from sources believed to be reliable, author does not guarantee its accuracy or completeness, nor does author assume any liability for any direct, indirect or consequential loss that may result from the reliance by any person upon any such information or opinions.
Futures, Options on Futures, Foreign Exchange and other leveraged products involves significant risk of loss and is not suitable for all investors. Losses can exceed your deposits. Increasing leverage increases risk. Spot Gold and Silver contracts are not subject to regulation under the U.S. Commodity Exchange Act. Contracts for Difference (CFDs) are not available for US residents. Before deciding to trade forex, commodity futures, or digital assets, you should carefully consider your financial objectives, level of experience and risk appetite. Any opinions, news, research, analyses, prices or other information contained herein is intended as general information about the subject matter covered and is provided with the understanding that we do not provide any investment, legal, or tax advice. You should consult with appropriate counsel or other advisors on all investment, legal, or tax matters. References to FOREX.com or GAIN Capital refer to StoneX Group Inc. and its subsidiaries. Please read Characteristics and Risks of Standardized Options.