



US Dollar Rebound Appears Corrective, EUR/USD And GBPUSD Set To Bounce?
The US dollar’s rebound looks corrective, with positioning still net short while EUR/USD and GBP/USD approach key support levels hinting at near-term upside.
Share this:

The US dollar’s rebound continues to look corrective rather than a new uptrend. Commitment of Traders (COT) data shows large speculators and asset managers remain net short, with limited evidence of fresh buying. Meanwhile, EUR/USD and GBP/USD are testing key technical supports, raising the odds of near-term bounces as the greenback’s momentum stalls near resistance around 100.
View related analysis:
View related analysis:
US Dollar Rebound Appears Corrective, EUR/USD and GBP/USD Eye Upside Reversal
If we stand back to view the bigger picture for the US dollar, the weekly chart shows that the current ‘rebound’ is dwarfed by the sell-off that preceded it. That said, the 12.1% decline from the January high to the June low was due a pause for breath, given it marked the dollar’s largest fall since the 2022 peak.
My base case is for inflation to continue tapering and for employment data (once it becomes available again) to soften further, allowing the Fed to maintain its easing cycle into 2026. I’m not anticipating a hard landing, but that scenario could still be enough to keep dollar rallies capped, see momentum turn lower again, and support a Wall Street recovery into at least Q1 or Q2.
I suspect we’re witnessing the wave ‘C’ of an ABC correction and its high should peter out below 100. Should this rally extend, perhaps the dollar could be headed for 102 before bearish momentum truly returns.
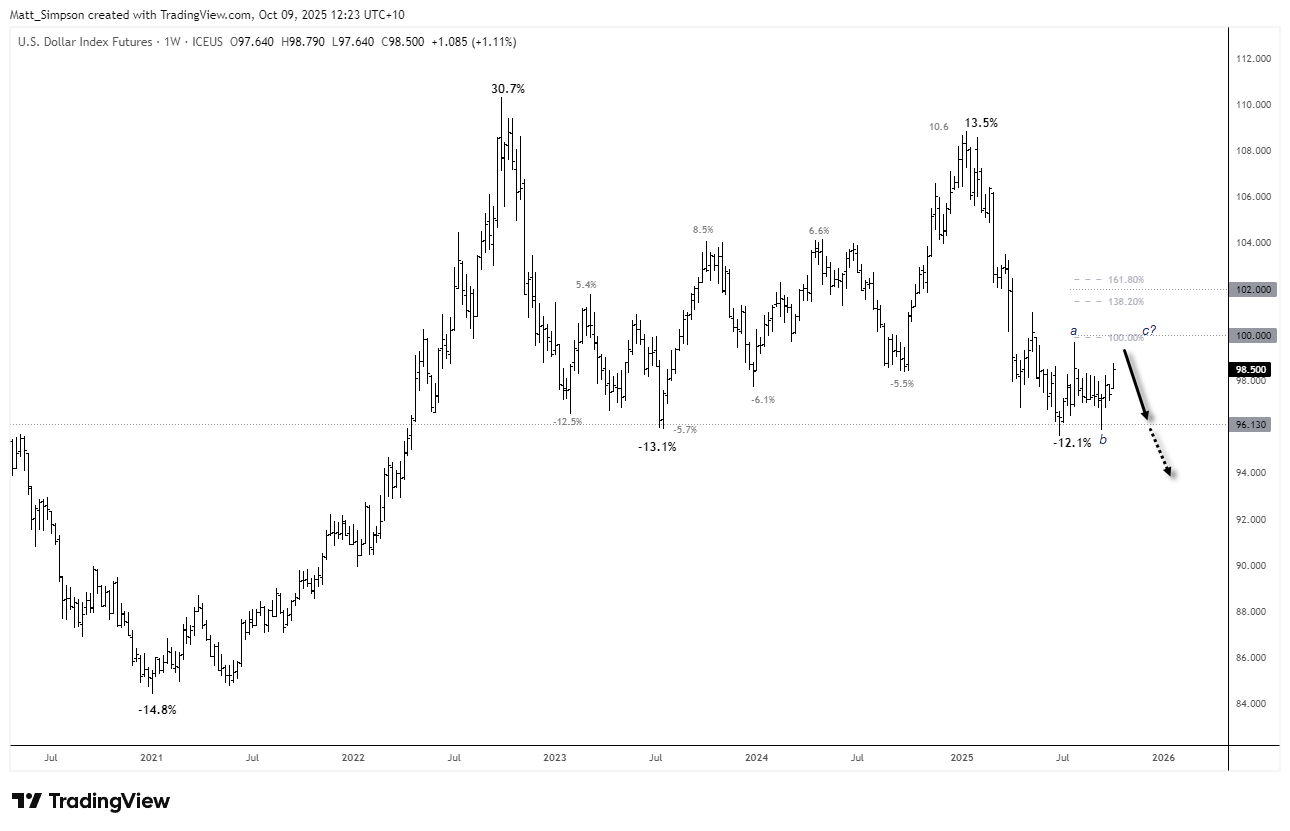
Chart analysis by Matt Simpson - data source: TradingView U.S. Dollar Index Futures


US Dollar Positioning (IMM Data): Weekly COT Report Analysis
While momentum for the US dollar index points higher, it has not been fully backed by market positioning in the latest Commitment of Traders (COT) report. Large speculators and managed funds remain net short, and recent weeks have actually seen them increase their gross-short exposure — not the behaviour typically seen during a genuine rebound.
Moreover, gross-long positions remain subdued. Asset managers were long by just 2k contracts, while large speculators added +1.5k contracts (12.4%) to reach 14k — still low by historical standards.
The dollar’s rise appears to be driven by short-covering as the government shutdown limits new economic data and prompts the unwinding of bearish bets. Until we see a meaningful pickup in fresh buying, USD bears may simply be waiting to reload at higher levels.
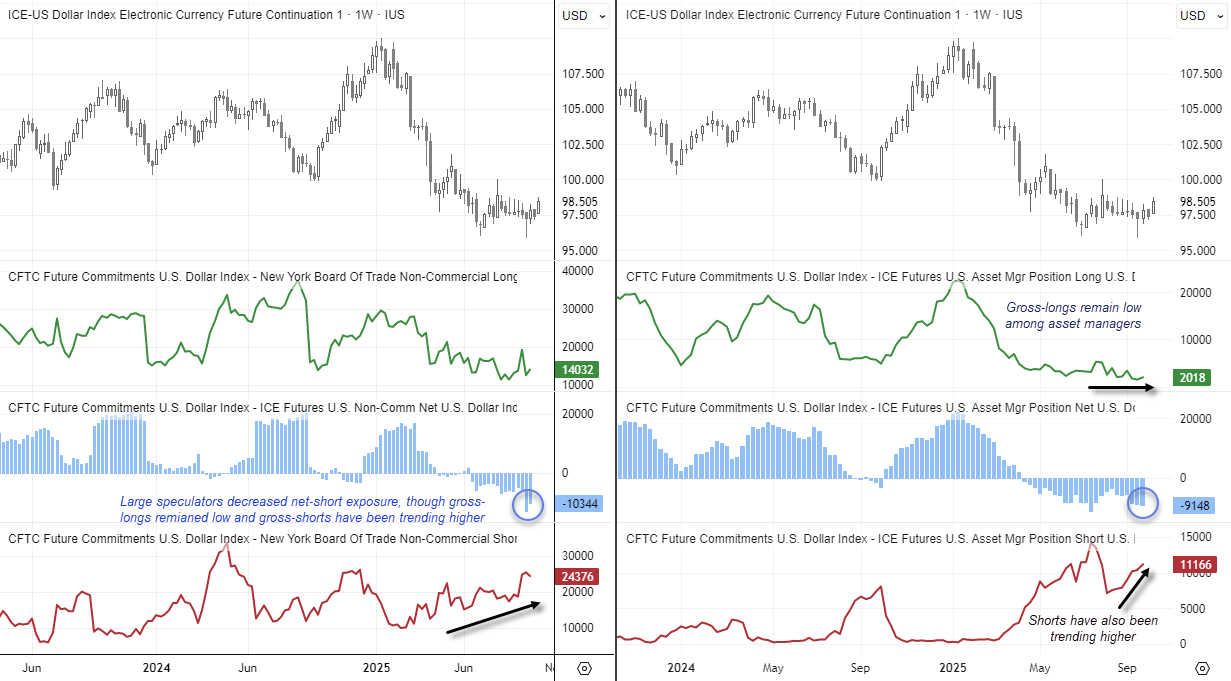
Chart analysis by Matt Simpson - data source: TradingView
US Dollar Index (DXY) Technical Analysis
The daily chart shows that the dollar’s rally has stalled around the 61.8% Fibonacci projection level. The daily RSI (2) reached overbought territory at yesterday’s close, signalling the potential for a near-term cycle high. However, with the RSI (14) trending higher alongside price and showing no bearish divergence, dips in the US dollar are likely to find buyers for now.
I’ll reassess the potential for a cycle high if the rally approaches the key resistance zone around 100.00, which aligns with the August swing high and the 100% projection level.
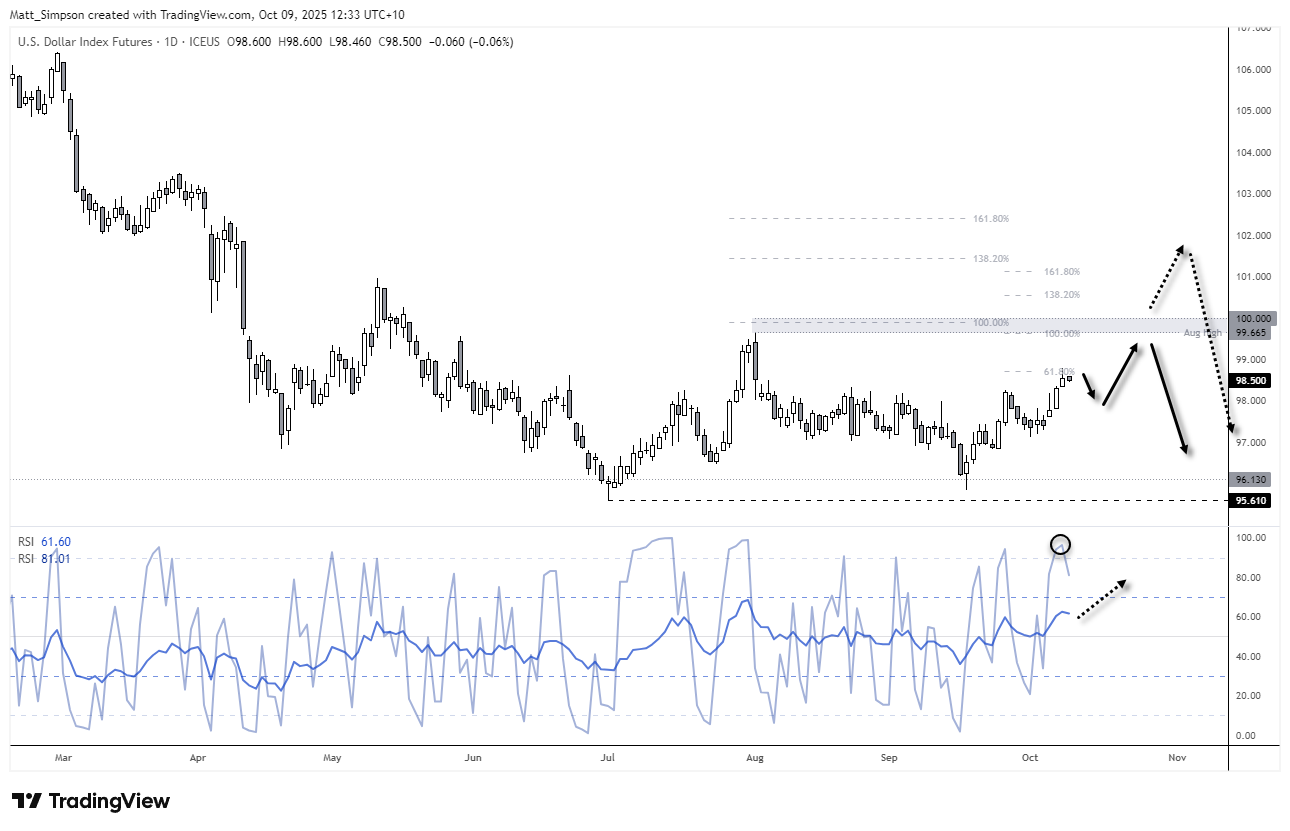
Chart analysis by Matt Simpson - data source: TradingView U.S. Dollar Index Futures


EUR/USD, GBP/USD Technical Analysis
We can’t really discuss the US dollar without mentioning EUR/USD, given the euro accounts for just under 60% of the USD Index weighting. It’s therefore worth noting that EUR/USD has so far held above 1.1160, though even a break beneath it could see prices find support and stage a bounce from the 100-day EMA and weekly VPOC near 1.1572. The daily RSI (2) also closed in oversold territory yesterday, hinting that a rebound could be near.
The British pound is also nearing a key support zone just above 1.3300. GBP/USD has formed two prominent swing lows in September, with price now attempting to hold above the June–July low around 1.3370. Given the potential for the US dollar’s rebound to pause, I suspect risks are tilted to the upside for both EUR/USD and GBP/USD in the near term.

Chart analysis by Matt Simpson - data source: TradingView EUR/USD, GBP/USD
View the full economic calendar
View the full economic calendar
-- Written by Matt Simpson
Follow Matt on Twitter @cLeverEdge
How to trade with City Index
You can trade with City Index by following these four easy steps:
- Open an account, or log in if you’re already a customer
• Open an account in the UK
• Open an account in Australia
• Open an account in Singapore
- Search for the market you want to trade in our award-winning platform
- Choose your position and size, and your stop and limit levels
- Place the trade
Related tags:
Latest market news




Open an account in minutes
Experience award-winning platforms with fast and secure execution.
Economic calendar
Web Trader platform
Our sophisticated web-based platform is packed with features.
Related articles
Australian Dollar Forecast: AUD/USD Breaks Multi-Month Range, Hits 10-Month Low 11 14 2026
Aussie bears are closing in on major technical support, with next week's Australian employment data raising the stakes for a pivotal reaction.

USD/JPY Weekly Outlook: Bulls Eye Higher Range After Historic Rate Shock
A historic US rate shock has sent USD/JPY above 160, but with intervention risks rising and few major economic catalysts ahead, AI sentiment could hold the key to the next move.

US Dollar Price Action Setups: EUR/USD, USD/JPY
The US Dollar broke out to a fresh yearly high after the CPI report, and that Dollar strength was on full view in pretty much all major pairings with a particular push in EUR/USD.
The information on this web site is not targeted at the general public of any particular country. It is not intended for distribution to residents in any country where such distribution or use would contravene any local law or regulatory requirement. The information and opinions in this report are for general information use only and are not intended as an offer or solicitation with respect to the purchase or sale of any currency or CFD contract. All opinions and information contained in this report are subject to change without notice. This report has been prepared without regard to the specific investment objectives, financial situation and needs of any particular recipient. Any references to historical price movements or levels is informational based on our analysis and we do not represent or warranty that any such movements or levels are likely to reoccur in the future. While the information contained herein was obtained from sources believed to be reliable, author does not guarantee its accuracy or completeness, nor does author assume any liability for any direct, indirect or consequential loss that may result from the reliance by any person upon any such information or opinions.
Futures, Options on Futures, Foreign Exchange and other leveraged products involves significant risk of loss and is not suitable for all investors. Losses can exceed your deposits. Increasing leverage increases risk. Spot Gold and Silver contracts are not subject to regulation under the U.S. Commodity Exchange Act. Contracts for Difference (CFDs) are not available for US residents. Before deciding to trade forex, commodity futures, or digital assets, you should carefully consider your financial objectives, level of experience and risk appetite. Any opinions, news, research, analyses, prices or other information contained herein is intended as general information about the subject matter covered and is provided with the understanding that we do not provide any investment, legal, or tax advice. You should consult with appropriate counsel or other advisors on all investment, legal, or tax matters. References to FOREX.com or GAIN Capital refer to StoneX Group Inc. and its subsidiaries. Please read Characteristics and Risks of Standardized Options.