



Index in Focus: China A50
Poor economic data combined with the constant closing and re-opening of certain areas in China have the China A50 on its heels.
Share this:

The news out of China lately hasn’t been great. China’s Caixin Manufacturing PMI released earlier today for August was 49.5 vs 50.2 expected and 50.4 in July. This is the lowest level since May and puts the Chinese economy under the 50 expansion/contraction level. Major reasons for the lower print include power outages and the ongoing closing and opening of cities due to Covid. Speaking of Covid, China has placed its 4th largest city, Chengdu, under lockdown. This region accounts for 1.75% of the country’s GDP. In addition, parts of China’s largest tech hub, Shenzhen, had several areas placed under lockdown. To make matters worse, the US has ordered Nvidia and AMD to halt sending AI chips to China and Russia. This all comes on the heels of poor economic data, including Industrial Production and Retail Sales. In addition, China’s housing sector has been plummeting due to failing property developers. Can the China A50 recover as it approaches its May lows?
The China A50 had been moving in a symmetrical triangle since mid-June 2015. However, on July 3rd, 2020, the index busted through the top of the wedge near 14700 and by February 18th, 2021, it reached an all-time high of 20603.10! Since then, the index has been moving lower, as concerns of inflation, an economic slowdown, and an increase of Covid cases began to move through China. Price tested the previously mentioned top trendline of the long-term triangle numerous times, only to finally come crashing through it on March 7th, 2022. Since May 2021, the China A50 has also been moving lower in a downward sloping channel, reaching a near-term low of 13186 in mid-March of this year.

Source: Tradingview, Stone X
Trade the China A50 now: Login or open a new account!
On a 240-minute timeframe, the China A50 is trading near the 61.8% Fibonacci retracement level from the lows of March 15th to the highs of July 5th, near 13354. If price breaks, the next level of horizontal support is at 12611, and then the lows of March 15th at 12288. Below there, price can fall to the bottom trendline of the long-term triangle near 11800. However, if the support holds and price bounces, first resistance is at highs from August 15th at 12766.6. Above there, resistance is at the top trendline of the previously mentioned long term triangle near 14270 and then the top, downward sloping trendline from the channel near 14690.

Source: Tradingview, Stone X
Poor economic data combined with the constant closing and re-opening of certain areas in China have the China A50 on its heels. Will the Index continue to move lower? The 61.8% Fibonacci retracement level from March 15th to July 5th may be the key level to watch!
Learn more about forex trading opportunities.
The news out of China lately hasn’t been great. China’s Caixin Manufacturing PMI released earlier today for August was 49.5 vs 50.2 expected and 50.4 in July. This is the lowest level since May and puts the Chinese economy under the 50 expansion/contraction level. Major reasons for the lower print include power outages and the ongoing closing and opening of cities due to Covid. Speaking of Covid, China has placed its 4th largest city, Chengdu, under lockdown. This region accounts for 1.75% of the country’s GDP. In addition, parts of China’s largest tech hub, Shenzhen, had several areas placed under lockdown. To make matters worse, the US has ordered Nvidia and AMD to halt sending AI chips to China and Russia. This all comes on the heels of poor economic data, including Industrial Production and Retail Sales. In addition, China’s housing sector has been plummeting due to failing property developers. Can the China A50 recover as it approaches its May lows?
The China A50 had been moving in a symmetrical triangle since mid-June 2015. However, on July 3rd, 2020, the index busted through the top of the wedge near 14700 and by February 18th, 2021, it reached an all-time high of 20603.10! Since then, the index has been moving lower, as concerns of inflation, an economic slowdown, and an increase of Covid cases began to move through China. Price tested the previously mentioned top trendline of the long-term triangle numerous times, only to finally come crashing through it on March 7th, 2022. Since May 2021, the China A50 has also been moving lower in a downward sloping channel, reaching a near-term low of 13186 in mid-March of this year.

Source: Tradingview, Stone X
Trade the China A50 now: Login or Open a new account!
• Open an account in the UK
• Open an account in Australia
• Open an account in Singapore
On a 240-minute timeframe, the China A50 is trading near the 61.8% Fibonacci retracement level from the lows of March 15th to the highs of July 5th, near 13354. If price breaks, the next level of horizontal support is at 12611, and then the lows of March 15th at 12288. Below there, price can fall to the bottom trendline of the long-term triangle near 11800. However, if the support holds and price bounces, first resistance is at highs from August 15th at 12766.6. Above there, resistance is at the top trendline of the previously mentioned long term triangle near 14270 and then the top, downward sloping trendline from the channel near 14690.
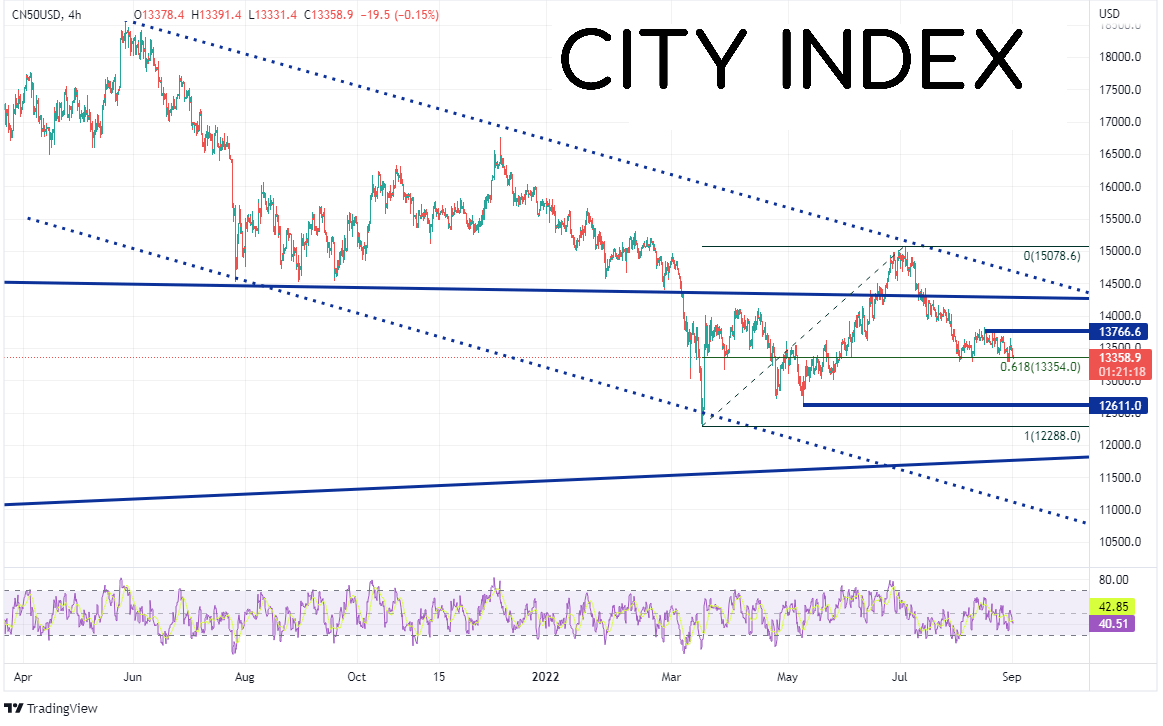
Source: Tradingview, Stone X
Poor economic data combined with the constant closing and re-opening of certain areas in China have the China A50 on its heels. Will the Index continue to move lower? The 61.8% Fibonacci retracement level from March 15th to July 5th may be the key level to watch!
Learn more about forex trading opportunities.
Related tags:


Open an account in minutes
Experience award-winning platforms with fast and secure execution.
Economic calendar
Web Trader platform
Our sophisticated web-based platform is packed with features.
Related articles
Gold coils for potential breakout as US CPI looms
Gold's ascending triangle is putting $4,140 firmly in focus ahead of US CPI. With traditional macro relationships offering few clues, the price action may prove more useful for traders.

USD/CAD Outlook: Loonie left behind as US CPI looms
USD/CAD's sharp rebound has coincided with widening US–Canada interest rate differentials. With US CPI approaching and bullish momentum building, another breakout may be on the cards.

Japanese Yen Outlook: EUR/JPY and GBP/JPY Outbid USD/JPY
The Japanese yen starts the week mixed, with EUR/JPY and GBP/JPY showing bullish potential while USD/JPY remains stuck in a rut.

The information on this web site is not targeted at the general public of any particular country. It is not intended for distribution to residents in any country where such distribution or use would contravene any local law or regulatory requirement. The information and opinions in this report are for general information use only and are not intended as an offer or solicitation with respect to the purchase or sale of any currency or CFD contract. All opinions and information contained in this report are subject to change without notice. This report has been prepared without regard to the specific investment objectives, financial situation and needs of any particular recipient. Any references to historical price movements or levels is informational based on our analysis and we do not represent or warranty that any such movements or levels are likely to reoccur in the future. While the information contained herein was obtained from sources believed to be reliable, author does not guarantee its accuracy or completeness, nor does author assume any liability for any direct, indirect or consequential loss that may result from the reliance by any person upon any such information or opinions.
Futures, Options on Futures, Foreign Exchange and other leveraged products involves significant risk of loss and is not suitable for all investors. Losses can exceed your deposits. Increasing leverage increases risk. Spot Gold and Silver contracts are not subject to regulation under the U.S. Commodity Exchange Act. Contracts for Difference (CFDs) are not available for US residents. Before deciding to trade forex, commodity futures, or digital assets, you should carefully consider your financial objectives, level of experience and risk appetite. Any opinions, news, research, analyses, prices or other information contained herein is intended as general information about the subject matter covered and is provided with the understanding that we do not provide any investment, legal, or tax advice. You should consult with appropriate counsel or other advisors on all investment, legal, or tax matters. References to FOREX.com or GAIN Capital refer to StoneX Group Inc. and its subsidiaries. Please read Characteristics and Risks of Standardized Options.