


Over the past four trading sessions, the S&P 500 (SPX) has declined by more than 1.2% from its all-time highs, as a new bearish bias begins to gain relevance in the short term. Selling pressure has persisted in part because long-term equity market confidence remains in neutral territory, while ongoing shifts in the Federal Reserve’s outlook for 2026 have started to weigh on recent demand. This lack of clarity has prevented a sustained buying interest from taking hold in the index. If this environment persists, selling pressure could gain further traction in the sessions ahead.

No Clear Path Forward?
The start of 2026 has been accompanied by a persistent sense of neutrality across equity markets, mainly because there is still no clear indication of when the next rate cut by the Federal Reserve might occur. It is important to recall that one of the key confidence catalysts for equities is the expectation of lower interest rates, as these reduce borrowing costs, boost liquidity, and support consumption—key drivers of demand for equities and, by extension, the SPX.
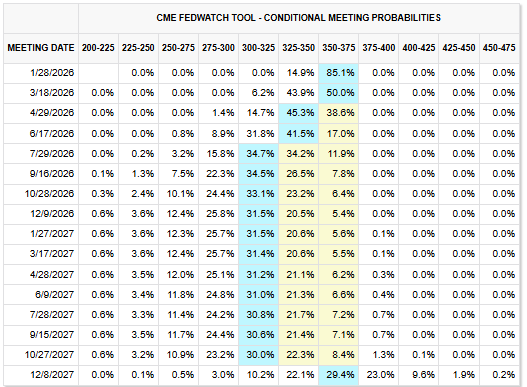
However, the Federal Reserve’s probability outlook at the beginning of the year points to a neutral rate environment. Currently, markets assign an 85.1% probability that rates will remain unchanged at the January 28 meeting, and close to 50% that this stance will also be maintained at the March 18 meeting. This scenario pushes back expectations of near-term rate cuts and reinforces policy indecision, limiting the recovery of confidence in the equity market.
Source: CMEGROUP
This backdrop has begun to reduce the likelihood that equities will benefit from lower interest rates in the short term and has encouraged flows into other markets, such as bonds, which tend to perform better in neutral-rate environments. As bonds gain relative appeal, demand for equity indices may be displaced. In the absence of strong macroeconomic data during the early sessions of the year, this cautious sentiment appears to be prevailing. Until there is greater clarity around potential rate cuts during the first quarter of 2026, this environment may continue to act as a drag on confidence and lead to more consistent selling pressure in the SPX.
What About Long-Term Confidence?
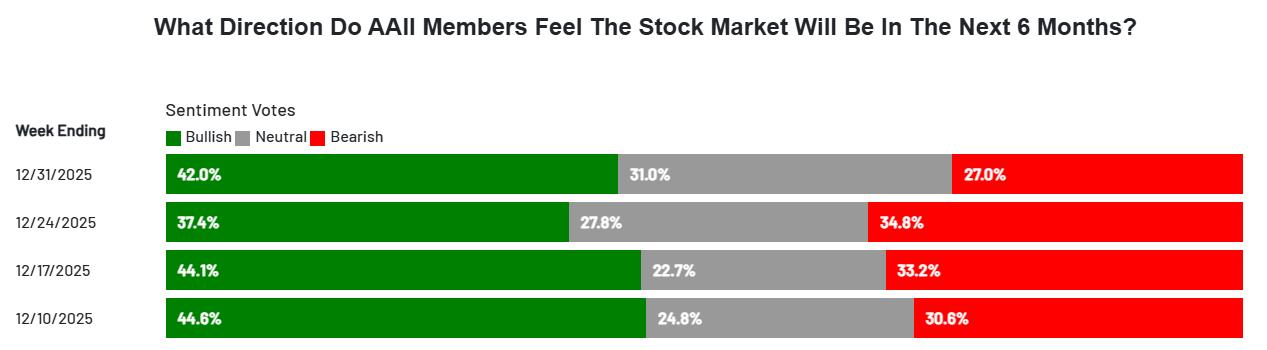
Beyond short-term uncertainty, long-term confidence also shows signs of indecision. According to the AAII Investor Sentiment Survey, 42% of investors hold a bullish outlook for equities over the next six months. However, 31% remain neutral and 27% maintain a bearish stance, highlighting a lack of clear consensus on the market’s future direction.
Source: AAII
As long as the index fails to show a meaningful improvement in optimism, this long-term indecision may continue to limit the formation of solid buying demand in the short term. Without a clear shift in sentiment, SPX may continue to move through a phase of uncertainty, potentially fueling additional episodes of selling pressure in the coming sessions.
S&P 500 Technical Outlook
Source: StoneX, Tradingview
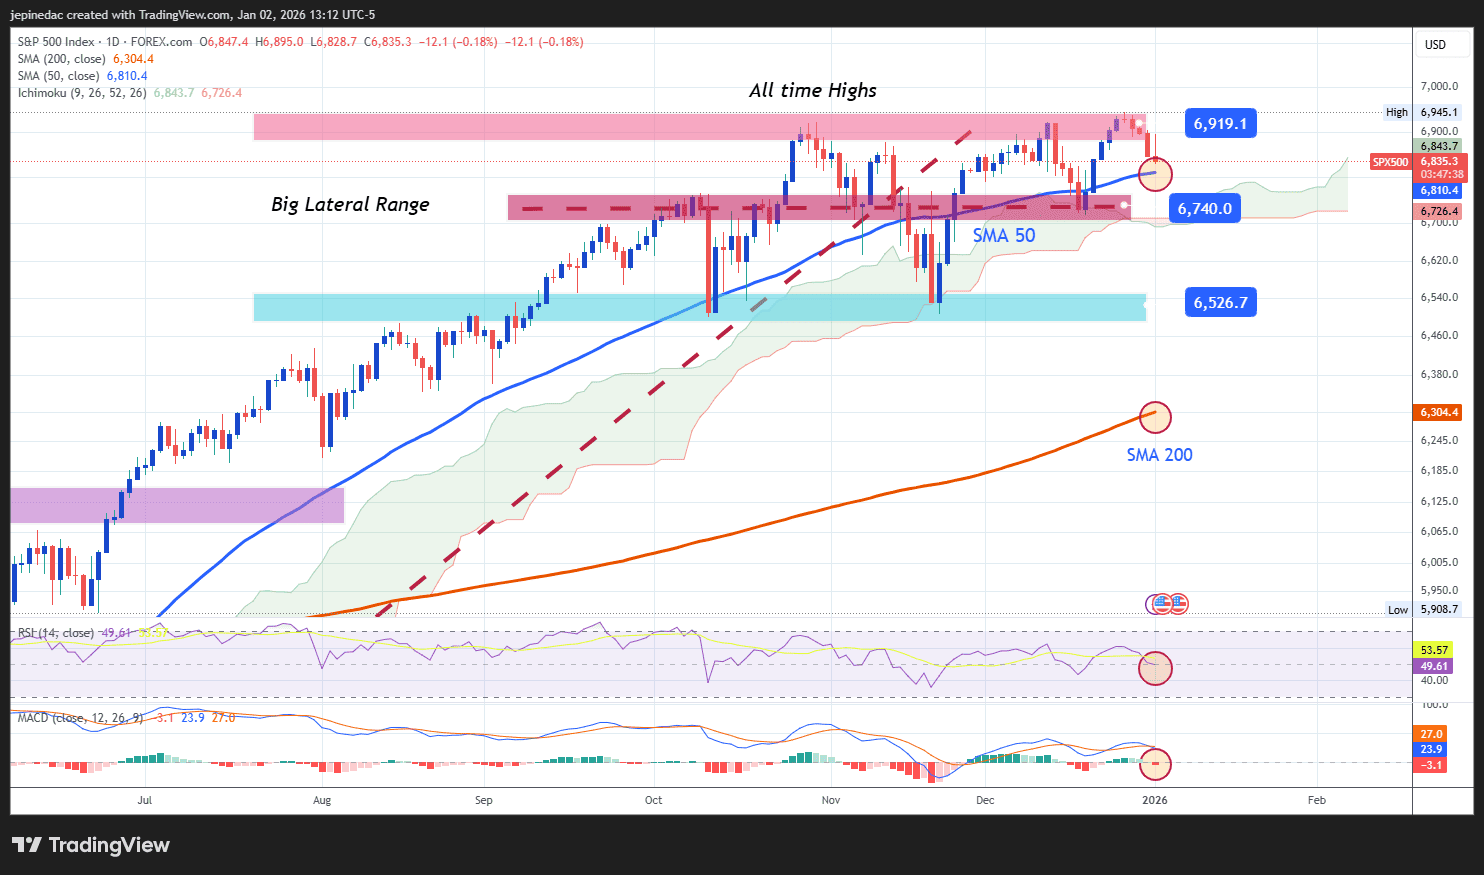
- A well-defined sideways range remains in place: Over recent months, SPX has traded within a clearly defined consolidation range, capped near 6,900 points and supported around 6,500 points. So far, price action has not been strong enough to break this structure, leaving the range as the most relevant technical formation to monitor. As long as these dynamic holds, it will be difficult for clear directional trends to emerge in the short term.
- RSI: The RSI continues to oscillate around the neutral 50 level, indicating a balance between buying and selling forces over the past 14 sessions. This behavior reinforces the view of a market in a neutral phase, where indecision may continue to dominate index movements.
- MACD: The MACD also reflects persistent neutrality, with its histogram hovering near the zero line. This suggests balanced short-term moving average momentum and supports the idea that a lack of directional impulse may continue to limit the emergence of consistent demand in SPX.
Key Levels:
- 6,900 points – Key resistance: This level aligns with the index’s all-time highs and represents the most important short-term upside barrier. A sustained move above this area could reactivate a dominant bullish bias, bring the consolidation range to an end, and open the door to a renewed bullish phase similar to that seen during part of 2025.
- 6,700 points – Nearby barrier: A level corresponding to a recent low. A break below this area could trigger a short-term bearish bias, keeping the consolidation structure intact in the sessions ahead.
- 6,500 points – Key support: This level corresponds to the most relevant lows from November 2025 and aligns with the lower boundary of the consolidation range. Sustained moves toward this zone could put the consolidation structure at risk and open the door to a more defined bearish trend.
Written by Julian Pineda, CFA, CMT – Market Analyst
Follow him on: @julianpineda25






