



Coming into this year I wrote the equities portion of this year’s forecast, and I warned of a ‘melt up’ situation as we had a degree of alignment between fiscal and monetary policy; and despite exuberant valuations already showing in stocks, there remained an open door for investors get even more frantic. But – as always in trading, timing matters, and I had highlighted the ideal scenario where a pullback could allow for entry into bullish trend continuation scenarios.
That scenario arrived in February and March as the United States made a move on Iran, and two months later even with an abundance of questions around oil supplies and the Strait of Hormuz, US equities have jumped to fresh all-time-highs. At the low, SPX saw daily RSI sink to oversold territory and since then bulls have staged a remarkable come back, with buying activity so frenzied that there remain numerous unfilled gaps from along the way in the cash index.
SPX Daily Price Chart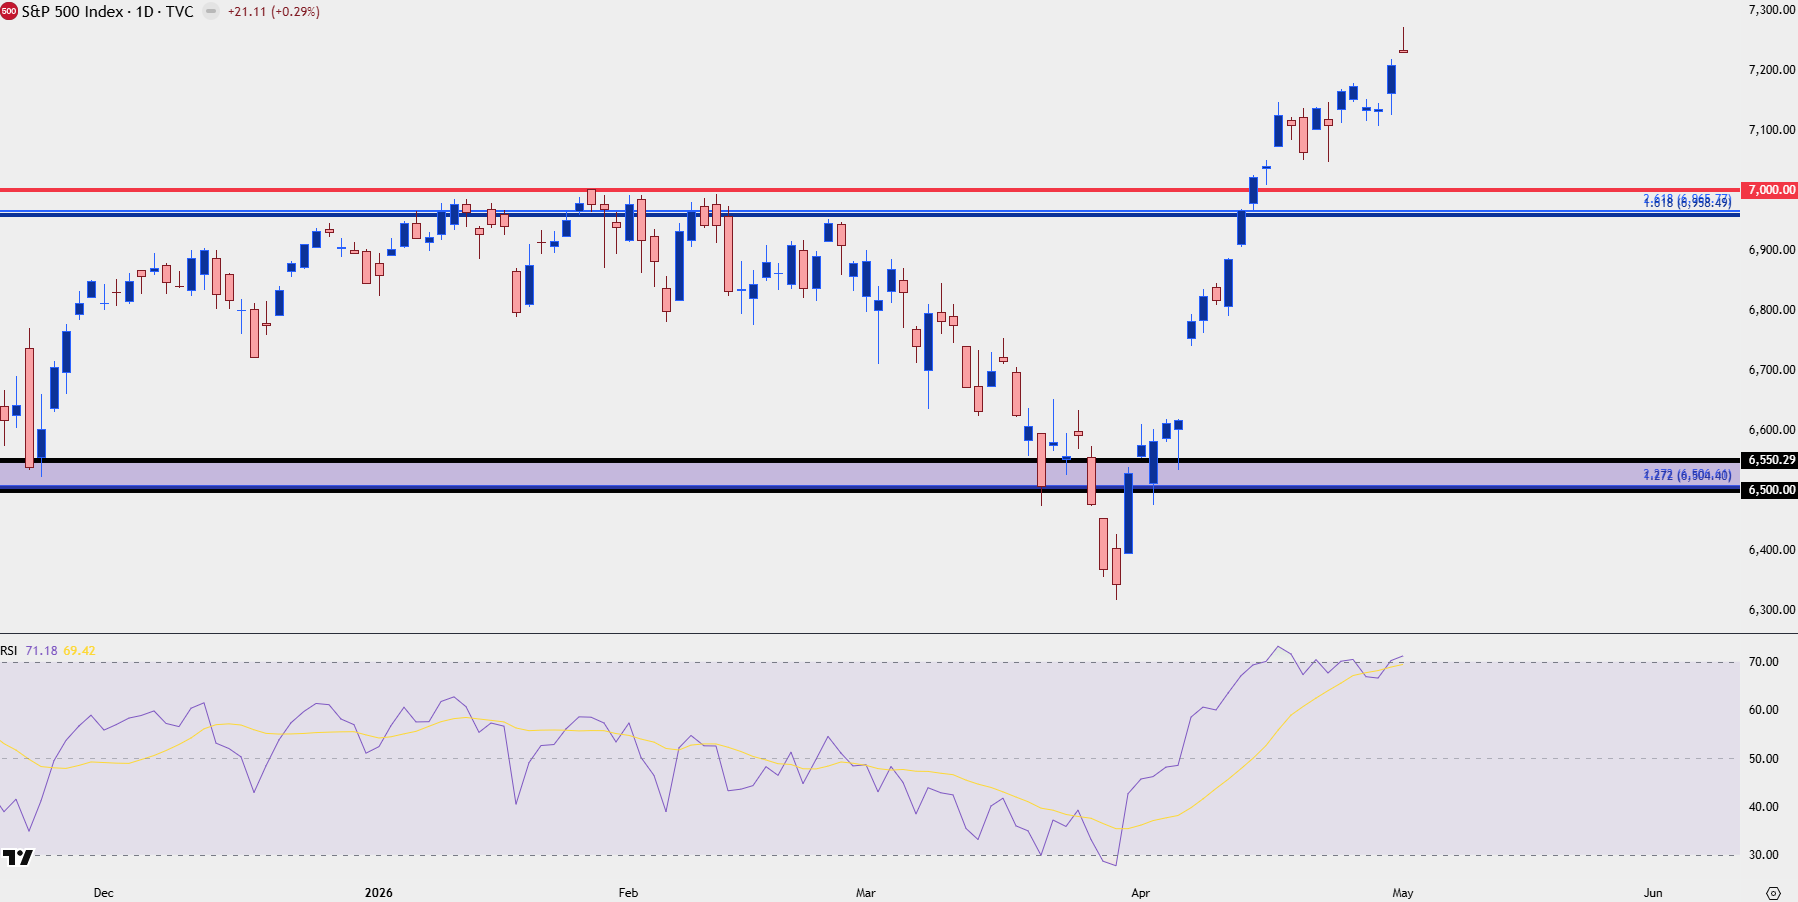
Chart prepared by James Stanley; data derived from Tradingview
SPX Strategy v/s Emotion
As you can also see from the above chart, RSI is overbought and of late has been diverging. I don’t necessarily look to RSI as a timing indicator as it’s quite laggy, particularly for counter-trend moves, but it does highlight the challenge of chasing at current levels.
Also of note, and something I’ll talk about in greater detail regarding the Nasdaq 100 below, is the performance of NVDIA, which rallied by more than 31% in a little more than four weeks to create another fresh all-time-high – and this is for a $4 Trillion Dollar company, which is just outlandish to consider. But, that’s sentiment showing and investors responded in a big way to a clean 23.6% pullback in the market leader.
For SPX, this highlights the danger of chasing and, instead, points to the power of patience. At this point, we haven’t yet seen a test of show of support at the 7k psychological level that was previously a hard spot of resistance. I’ve got that spanned down to my 2025 top-end target of 6958, which is a Fibonacci projection level, to create a zone to look for higher-low support. Below that, we have two unfilled gaps, from 6887-6905 and then from 6618-6740. And lastly, another area of prior resistance spanning from 6500-6550.
SPX Daily Price Chart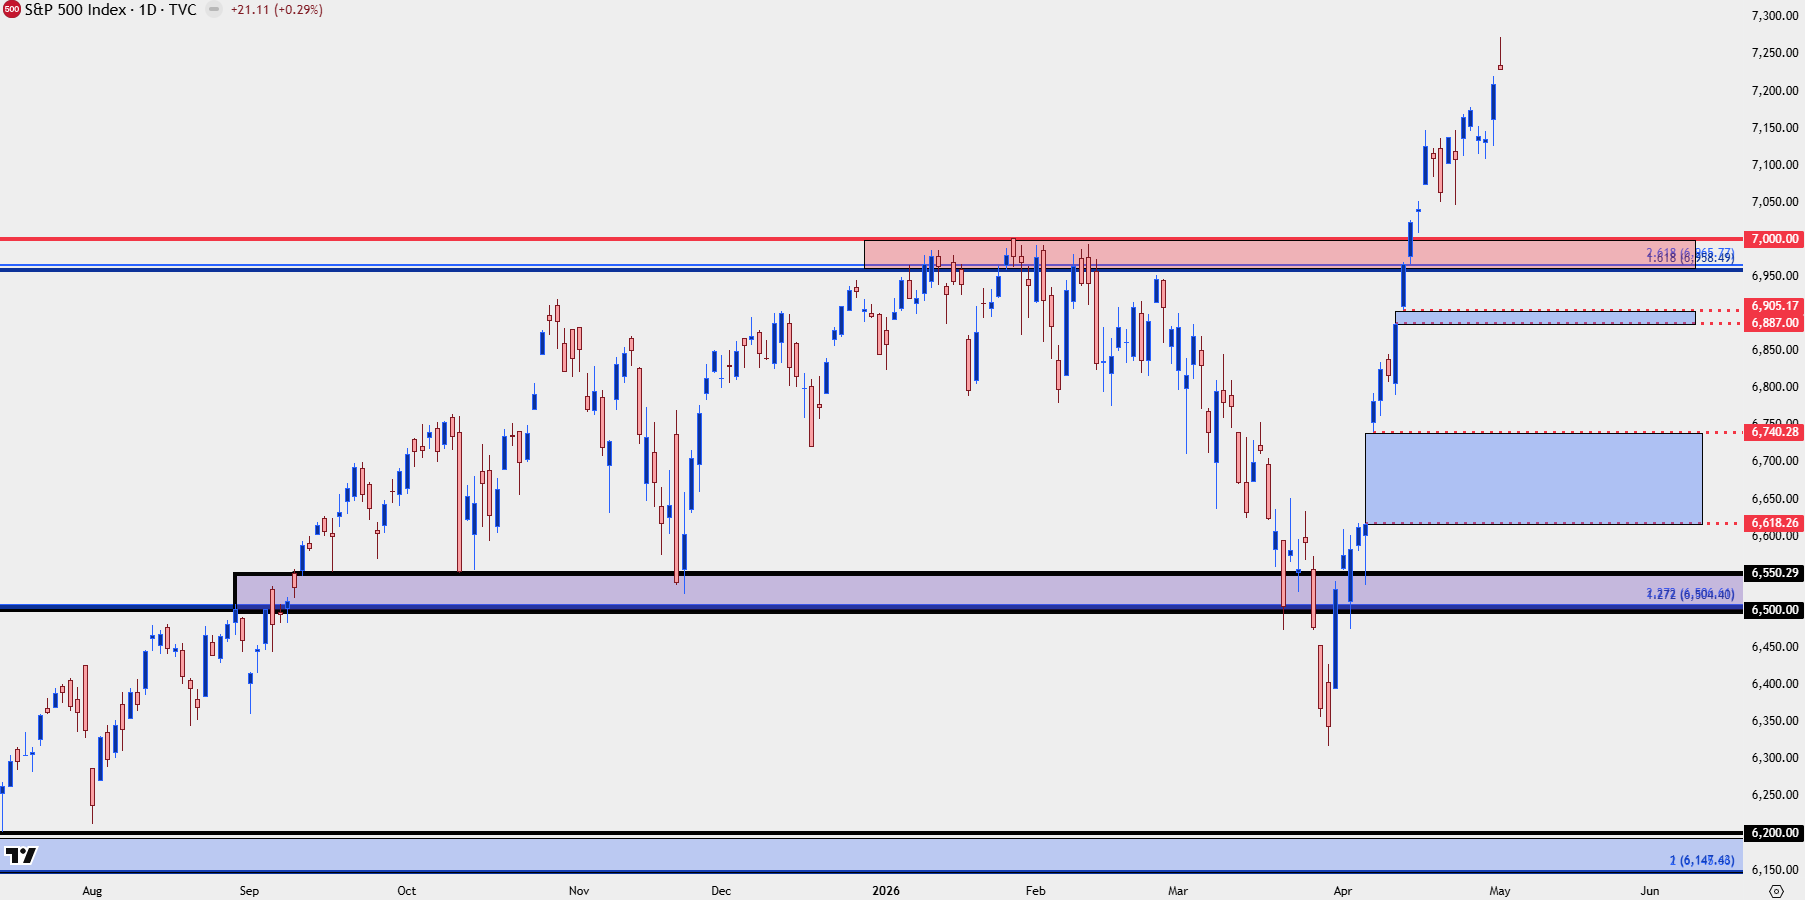
Chart prepared by James Stanley; data derived from Tradingview
Nasdaq
Even as the sell-off was hitting hard during March in the S&P 500, the Nasdaq had held up a bit better on a relative degree. This is what points to the fact that even with fear gripping markets, investors remained optimistic that, eventually, economic growth would prevail. And they used that pullback in premium names like NVDIA to add or start positions, which eventually ran to a fresh ATH.
But this is now a factor to consider if thinking of chasing, as NVDA just posted a red week with a bearish engulf, indicating that investors this week used the rally to fresh ATHs to pare positions. This doesn’t necessarily denote reversal, but it does highlight both the danger of chasing and the possible power of patience.
There’s now a big spot of support as taken from prior resistance around 192.69, and below that, the 164.66 Fibonacci level stands out as that’s what’s previously been defended. If we get below that I’m of the mind that something will have shifted in the backdrop, but that would also open up the possibility of a support test at the 150 level which was also a prior spot of resistance.
NVDA Weekly Chart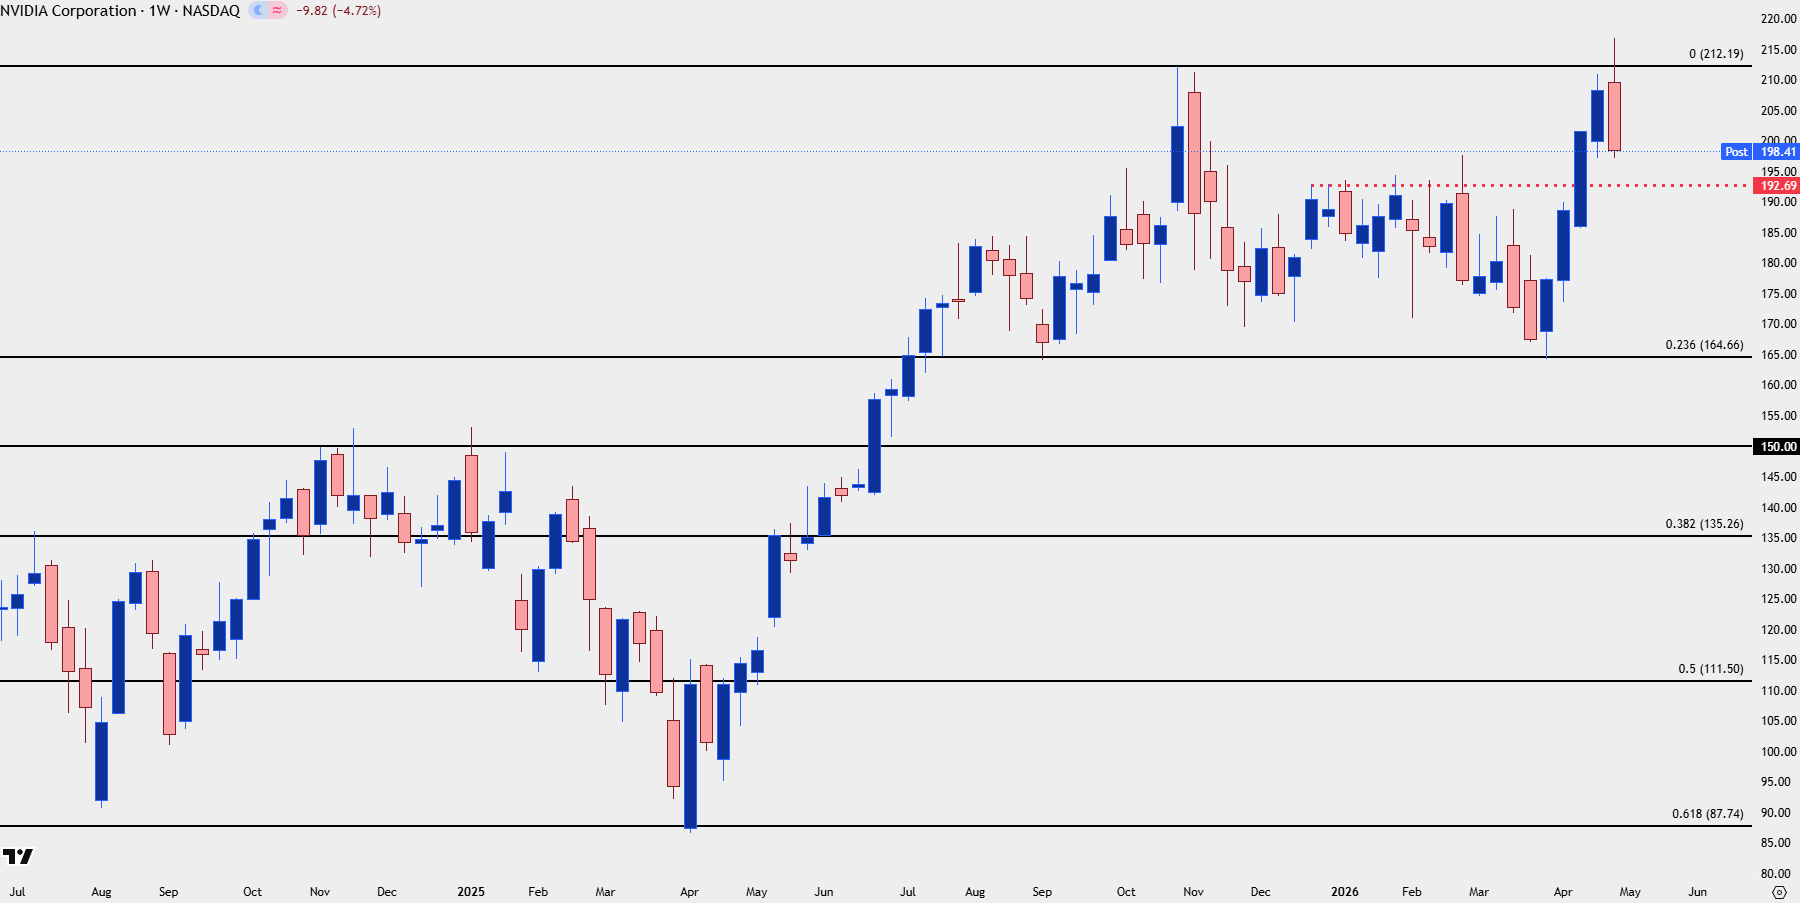
Chart prepared by James Stanley; data derived from Tradingview
Nasdaq 100
For the broader tech index, bulls have continued to rip, with prices pushing five strong weeks and a monthly gain for April of more than 15% in NQ futures. From support at 23k it’s basically been a straight shot-higher nearing the 28k mark, and while that momentum is enticing it’s simply dangerous to chase such a well developed move.
For support, the prior ATH of 26,400 stands out, with the area around 25k-25,465 just below that. And even a re-test of the 24k area could be argued as a higher-low, although like NVDA above, for that scenario to develop it would be wise to consider what change may have taken place in the backdrop.
Nasdaq 100 Weekly Price Chart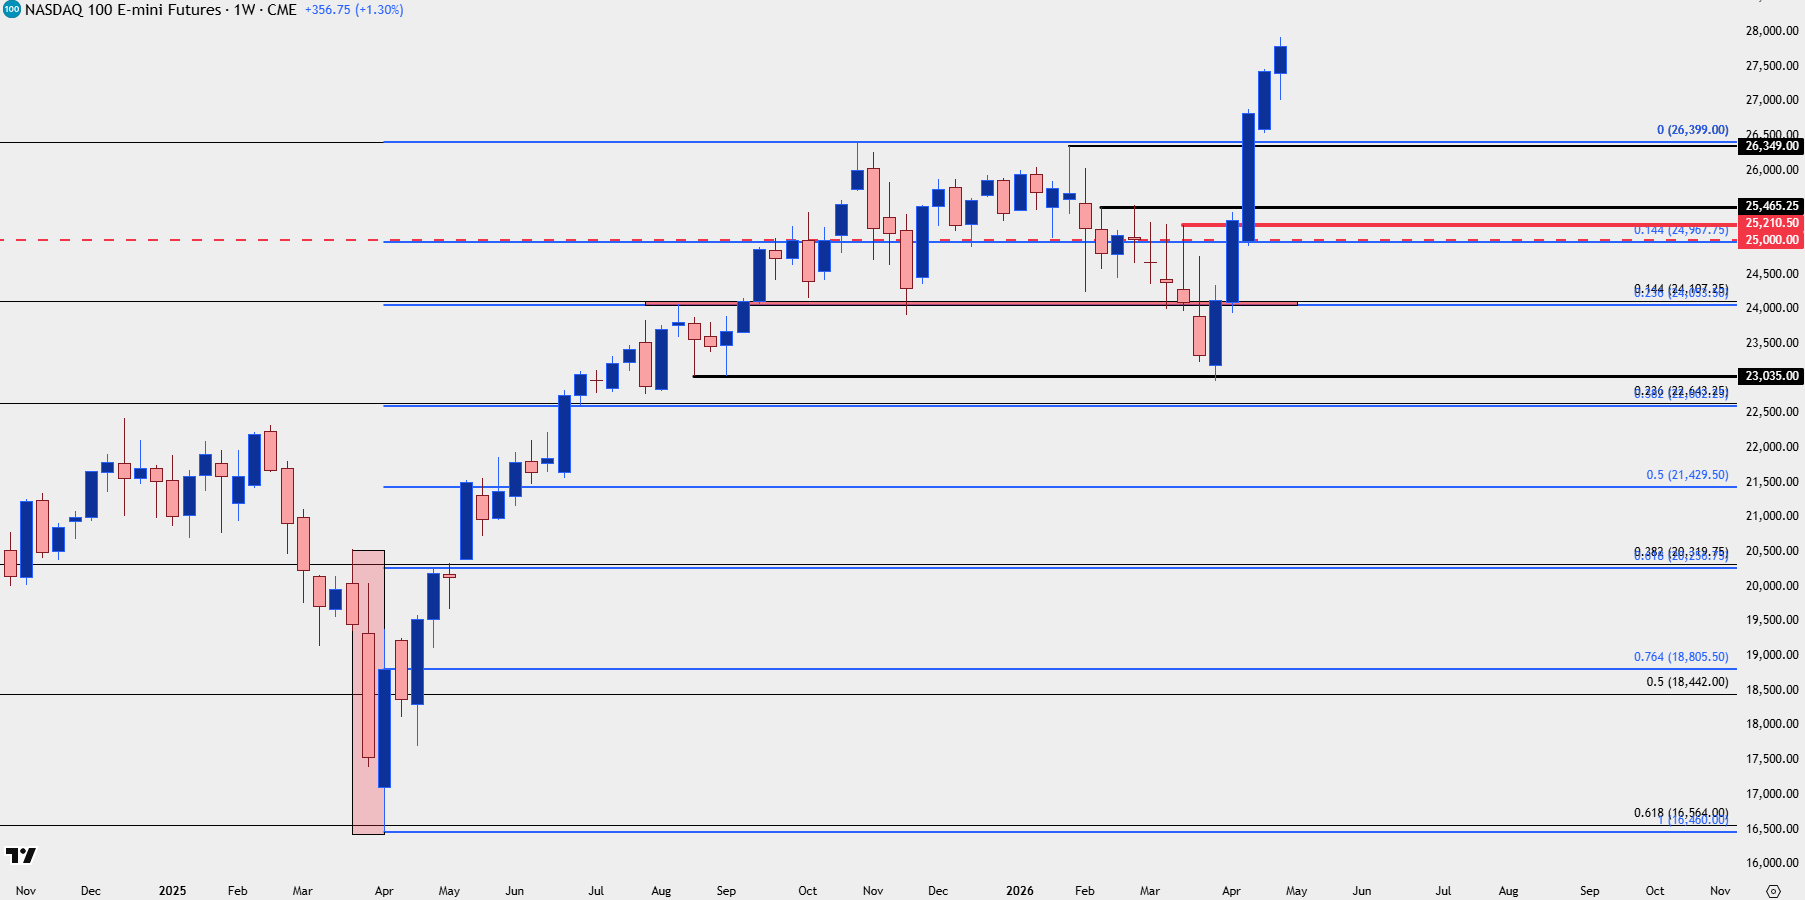
Chart prepared by James Stanley; data derived from Tradingview
--- written by James Stanley, Senior Market Analyst, Global Macro






