


In last week’s webinar I looked at a big spot of support in the US Dollar and that was the same I had looked at the week before, qualifying it as an ‘s3’ spot of support. This was also prior resistance in February, before the ascending triangle formation led to bullish breakout and for the past week – that price has been holding the lows in DXY.
This keeps the door open for USD-strength but as usual for the US Dollar Price Action Setups webinar, I looked at setups on either side of the matter with EUR/USD and GBP/USD for USD-weakness and USD/JPY and USD/CAD for USD-strength.
US Dollar Daily Price Chart
Chart prepared by James Stanley; data derived from Tradingview
EUR/USD
In the webinar I drew a comparison to the current backdrop in DXY to the setup in EUR/USD earlier in April, where sellers were still swinging as evidenced by the hold of resistance but notably, buyers had taken a step up as they were defending supports at higher-lows.
In EUR/USD, that led to an explosive bullish move in early-April on the back of the ceasefire announcement and that rally eventually stretched up to the resistance at 1.1833. That has since held the highs and yesterday saw a bounce from support at 1.1742. But sellers are now taking another swing and in the webinar I looked at the EUR/USD backdrop from a couple of different perspectives, with 1.1729 setting as the low yesterday and what would need to be defended to keep the current backdrop alive for a higher-low. Next support down plots at 1.1699 after which prior resistance of 1.1628-1.1655 comes into play, and so far, that zone has only shown as short-term support.
EUR/USD Daily Price Chart
Chart prepared by James Stanley; data derived from Tradingview
GBP/USD
I’m keeping Cable on the bearish USD side of the radar, although I think that I still find the pair more attractive for such scenarios than EUR/USD above.
At this point, there’s been a similar stalling at a big resistance level that I was looking at previously, and so far, there’s been a hold of support at prior resistance around 1.3484 which was a key swing high in March. I’m tracking next support at another familiar zone, from around 1.3414-1.3434.
GBP/USD Daily Price Chart
Chart prepared by James Stanley; data derived from Tradingview
USD/JPY
All factors equal, USD/JPY has held up incredibly well considering how much the USD has sold off elsewhere. While both EUR/USD and GBP/USD have pushed into bullish trends with fresh higher highs USD/JPY has so far held a key spot of support from 157.66-157.90, which has been a popular spot on my chart in the past few webinars.
That zone was in-play again last week with the Friday sell-off, holding yet another bounce as prices rallied up to just under the 160.00 handle. For USD-strength scenarios, this is still my favored market – and the dynamic noted above can be extrapolated elsewhere like EUR/JPY and GBP/JPY, both of which have been regular appearances in webinars over the past few weeks.
If we do get a stretch in the USD rally, USD/JPY could finally get that next 160.00 test and as I’ve been saying of late, this might not be a simple case for the BoJ to jump in to intervene, with overhead resistance at 161.95 and 165.00 setting up as possibly more attractive lines of defense in DXY breakout scenarios.
USD/JPY Daily Price Chart
Chart prepared by James Stanley; data derived from Tradingview
USD/CAD
For USD-strength there could be an argument for USD/CAD, as well. The pair came into April rallying on a breakout but stalled just shy of the 1.4000 psychological level. Sellers have continued to swing this month, however, and price slipped below the 1.3727 level and is now testing a prior spot of support-turned-resistance that runs from 1.3629-1.3643.
USD/CAD Daily Price Chart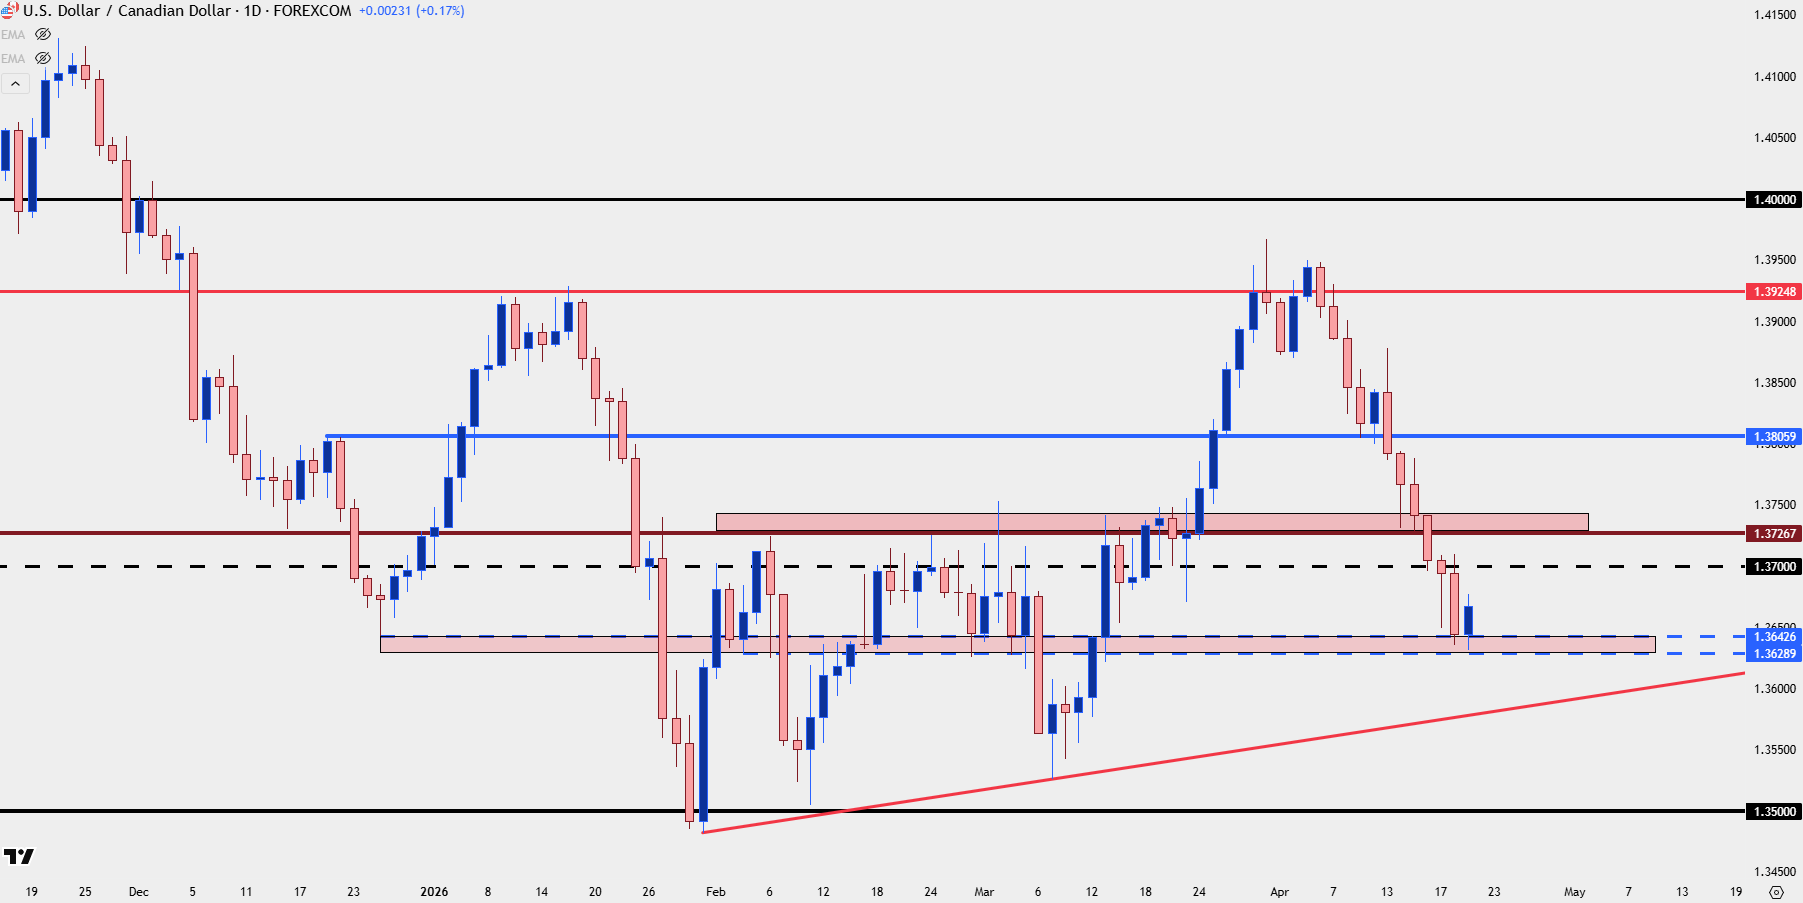
Chart prepared by James Stanley; data derived from Tradingview
--- written by James Stanley, Senior Market Analyst, Global Macro






