









USD/JPY, USD/CHF Rise for 2nd Day, Market Forces Lend SNB a Hand
Trade optimism send the US dollar higher for a second day, and sending demand for the Japanese yen and Swiss franc lower. This bodes well for my bullish outlook for USD/JPY and USD/CHF.
Share this:

The US dollar rose for a second day on Wednesday on trade optimism, after Trump said that China’s tariffs could be much lower. That US Treasury Secretary Scott Bessent had already said that that tensions with China could de-escalate soon means Trump’s late-night concession likely carries more weight.
View related analysis:
- Tentative Signs of a US Dollar Rebound Ahead of Powell speech
- Japanese Yen Analysis: USD/JPY, CAD/JPY, AUD/JPY Price Action Setups
- USD/CHF Hurled Overboard, Swiss Franc, Gold Remain Supreme
- AUD/USD Rebound Stalls Near 64c, 200-day EMA; PMIs In Focus
View related analysis:
- Tentative Signs of a US Dollar Rebound Ahead of Powell speech
- Japanese Yen Analysis: USD/JPY, CAD/JPY, AUD/JPY Price Action Setups
- USD/CHF Hurled Overboard, Swiss Franc, Gold Remain Supreme
- AUD/USD Rebound Stalls Near 64c, 200-day EMA; PMIs In Focus
- The US dollar rose 0.9% during its best day in twelve, pulling the euro (EUR/USD) down to a six-day low, and second beneath the 1.14 handle.
- The question now is whether the US dollar index can break above 100 to mark the beginning of a meaningful rebound for USD.
- The Australian dollar (AUD/USD) continued to meander around its 200-day EMA and 64c level, though an inverted hammer candle suggests a hesitancy remains among bulls to break above key resistance levels.
- The Swiss franc (USD/CHF) rose for a second day, marking its best 2-day run since March 2020
- The Japanese yen (USD/JPY) rose nearly 2% and rose for a second day, to mark its best 2-day run since December
A Higher USD/CHF Plays Nicely with the Swiss National Bank (SNB)
On 10 April I questioned whether the SNB would be forced to intervene in the currency market to support the surging Swiss franc (CHF). Not only had the franc risen over 14% against the dollar since the January low, but the extreme levels of volatility on the day forced USD/CHF below 0.92 – a level some had previously suggested was an intervention threshold for the SNB to support the franc.
10 April was also the fourth most bearish day on record at -4%, and the eighth most volatile, with a daily range of 4.2%. Curiously, there has been no apparent intervention from the central bank, though they have spoken about the potential for negative rates in an attempt to jawbone the franc. And if the US dollar continues to strengthen, as I suspect, this should reduce the need for the SNB to act, as USD/CHF should flourish.
Swiss Franc (USD/CHF) Technical Analysis
USD/CHF fell to its lowest level since the infamous day on 15 January, when the SNB removed the Swiss franc’s peg to the euro. USD/CHF printed an important low on Monday, just 41 pips shy of the 0.80 level, though Tuesday’s bullish engulfing candle strongly hinted at a swing low. The strength of the US dollar helped USD/CHF climb for a second consecutive day, though resistance looms nearby.
The daily chart suggests that USD/CHF could be a day or two's trade away from reaching 0.84, based on recent standards of volatility. However, with the 2023 low (0.8327) and 2024 low (0.8375) nearby, we may find that volatility recedes somewhat as USD/CHF approaches the 0.84 level.
Given the extended sell-off in the US dollar and the continued strength of the Swiss franc in recent weeks, USD/CHF remains vulnerable to a decent move higher should tariffs be significantly reduced for China. I therefore favour an initial move towards 0.84, followed by a minor pullback, ahead of a secondary move towards the 0.8565 VPOC, just beneath the 0.8600 handle.
Japanese Yen (USD/JPY) Technical Analysis
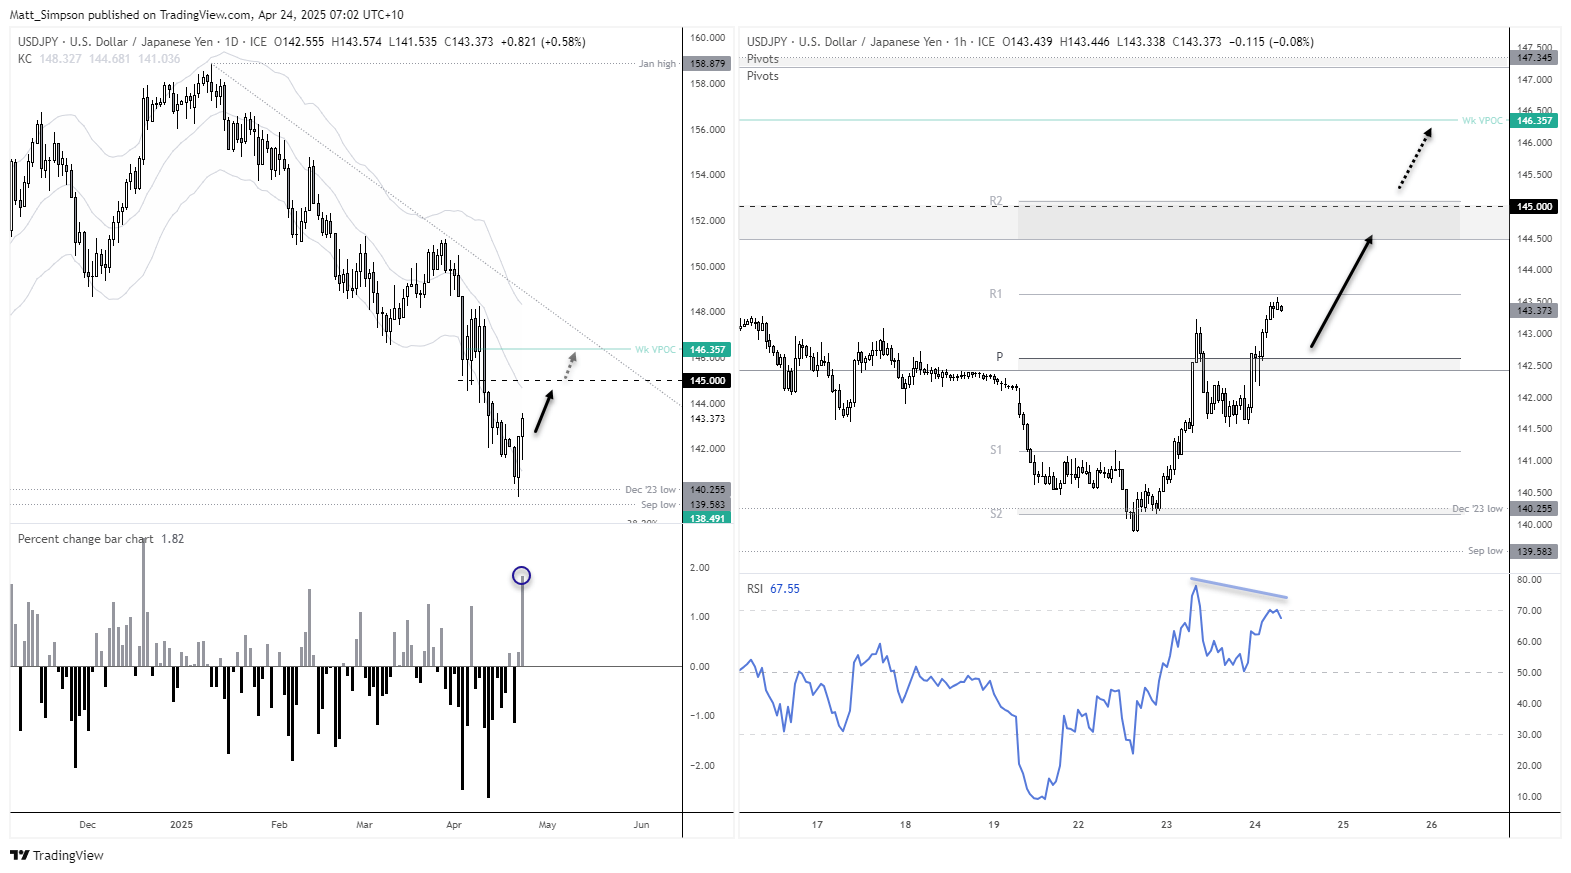
USD/JPY rose for a second day, in line with my bullish bias outlined in yesterday’s article. 145 remains the interim upside target, a break above which brings the 146 handle into focus near trend resistance and the 146.36 VPOC (volume point of control).
The 1-hour chart shows that the daily high for USD/JPY met resistance at the weekly R1 pivot (143.6), which, when coupled with the bearish RSI (14) divergence, could suggest a pullback is due before the trend resumes. Bulls could seek dips towards the 142.50 area, near the weekly pivot point (142.62) and monthly S3 pivot (142.33). Note the monthly S2 pivot at 144.45 and weekly R2 pivot at 145.07, which make potential interim targets for bulls.
Economic events in focus (AEDT)
- 09:50 – Japanese corporate services price index, foreigner bond and stock purchases
- 11:30 – RBA bulletin
- 13:35 – Japanese 2-year JGB auction
- 18:00 – German Ifo business climate
- 19:00 – UK 20-year gilt auction
- 22:30 – US jobless claims, Chicago Fed National Activity Index, durable goods orders
-- Written by Matt Simpson
Follow Matt on Twitter @cLeverEdge
How to trade with City Index
You can trade with City Index by following these four easy steps:
- Open an account, or log in if you’re already a customer
• Open an account in the UK
• Open an account in Australia
• Open an account in Singapore
- Search for the market you want to trade in our award-winning platform
- Choose your position and size, and your stop and limit levels
- Place the trade
Related tags:


Open an account in minutes
Experience award-winning platforms with fast and secure execution.
Economic calendar
Web Trader platform
Our sophisticated web-based platform is packed with features.
Related articles
Nikkei swings harder than Nasdaq as AI fears deepen
Nikkei 225 volatility is running well ahead of Nasdaq 100, with the index construction and Japan's heavy exposure to AI manufacturing potentially explaining the difference.

Forex & Gold Outlook: Dollar Dominates, Crosses Diverge
The US dollar rally gathers momentum as forex crosses develop contrasting technical setups. Matt Simpson examines eight FX markets and gold for potential trading opportunities.

Gold Outlook: Asia Buys the Dip, US Hammers the Rip
Asia buys the dip, the US sells the rip. Hourly gold, dollar and Treasury yield data reveal a regional divide that has become especially pronounced since September.
The information on this web site is not targeted at the general public of any particular country. It is not intended for distribution to residents in any country where such distribution or use would contravene any local law or regulatory requirement. The information and opinions in this report are for general information use only and are not intended as an offer or solicitation with respect to the purchase or sale of any currency or CFD contract. All opinions and information contained in this report are subject to change without notice. This report has been prepared without regard to the specific investment objectives, financial situation and needs of any particular recipient. Any references to historical price movements or levels is informational based on our analysis and we do not represent or warranty that any such movements or levels are likely to reoccur in the future. While the information contained herein was obtained from sources believed to be reliable, author does not guarantee its accuracy or completeness, nor does author assume any liability for any direct, indirect or consequential loss that may result from the reliance by any person upon any such information or opinions.
Futures, Options on Futures, Foreign Exchange and other leveraged products involves significant risk of loss and is not suitable for all investors. Losses can exceed your deposits. Increasing leverage increases risk. Spot Gold and Silver contracts are not subject to regulation under the U.S. Commodity Exchange Act. Contracts for Difference (CFDs) are not available for US residents. Before deciding to trade forex, commodity futures, or digital assets, you should carefully consider your financial objectives, level of experience and risk appetite. Any opinions, news, research, analyses, prices or other information contained herein is intended as general information about the subject matter covered and is provided with the understanding that we do not provide any investment, legal, or tax advice. You should consult with appropriate counsel or other advisors on all investment, legal, or tax matters. References to FOREX.com or GAIN Capital refer to StoneX Group Inc. and its subsidiaries. Please read Characteristics and Risks of Standardized Options.