


Rate cuts are in doubt for the US economy as Jerome Powell hosted his final rate decision atop the Fed, and that’s helped to contribute to a US Dollar rally with the DXY basket re-engaging with the familiar 98.98 level.
There’s still quite a bit of calendar to work through as both the ECB and BoE are expected to lean hawkish, which is at odds with the weakness showing in each of those currencies against the USD. But that both highlights what else is pushing behind the scenes along with opening up the opportunity for some change if those central banks do lean more-hawkish at their meetings tomorrow morning.
In the USD, there’s a pattern of strength that’s largely continued since the support hold at 98.28 early on Monday. Sitting overhead is a major area – the ceasefire gap – which runs from 99.18 up to 99.52. For that zone to get traded through we’re probably going to need to see some combination of continued breakout in USD/JPY combined with a softer-than-expected ECB.
US Dollar Hourly Price Chart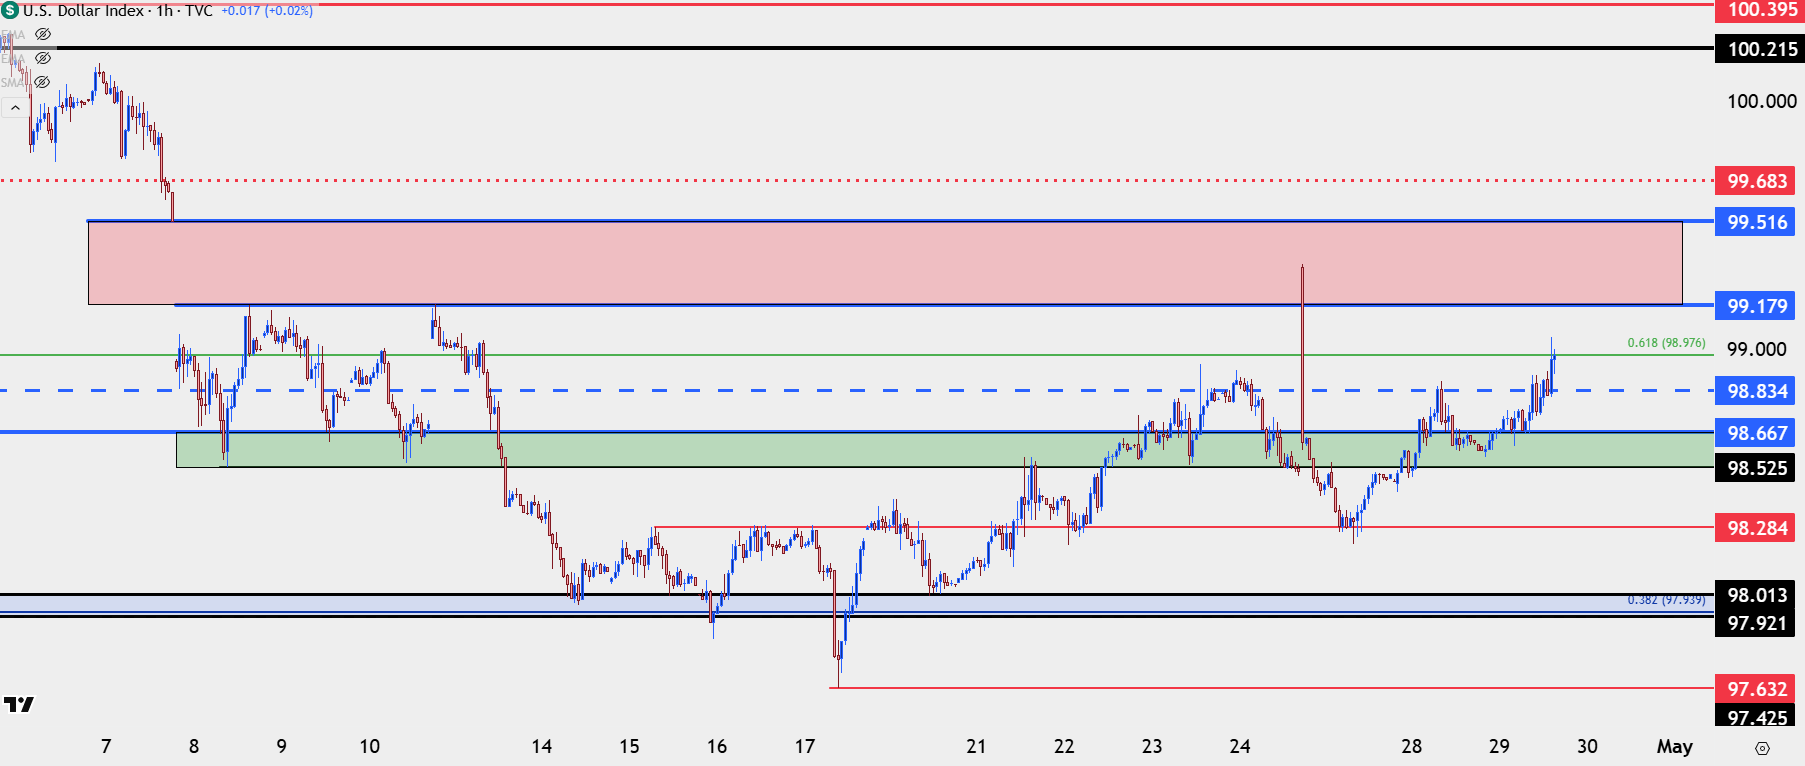
Chart prepared by James Stanley; data derived from Tradingview
USD/JPY 160.00
With oil prices heading higher and more opacity around the Strait of Hormuz Japan finds itself in an unenviable position where interventions could be even more challenging. And their finite FX reserves may need to be put in place in other ways in the coming months if we do see oil prices continuing to spike as the country has already drawn down on petroleum reserves.
I covered this in the webinar yesterday but a hawkish-sounding Kazuo Ueda got a much different response than in January, when the prospect of more Japanese rate hikes brought upon a strong pullback in the pair. But, earlier this week, bulls barely blinked and this morning, even ahead of the FOMC, traders drove spot prices above the 160.00 level.
This isn’t to say that they’ve already lost control because I don’t think that they have. But intervening at 160.00 could be akin to lighting cash on fire and, instead, they may simply draw the line-in-the-sand lower, to a 161.95 or a 165.00 level.
But this remains a big item to watch in my opinion, even with the ECB and BoE meetings dominating tomorrow’s calendar and the ongoing conflict in Iran stealing the headlines in the near-term.
USD/JPY Hourly Chart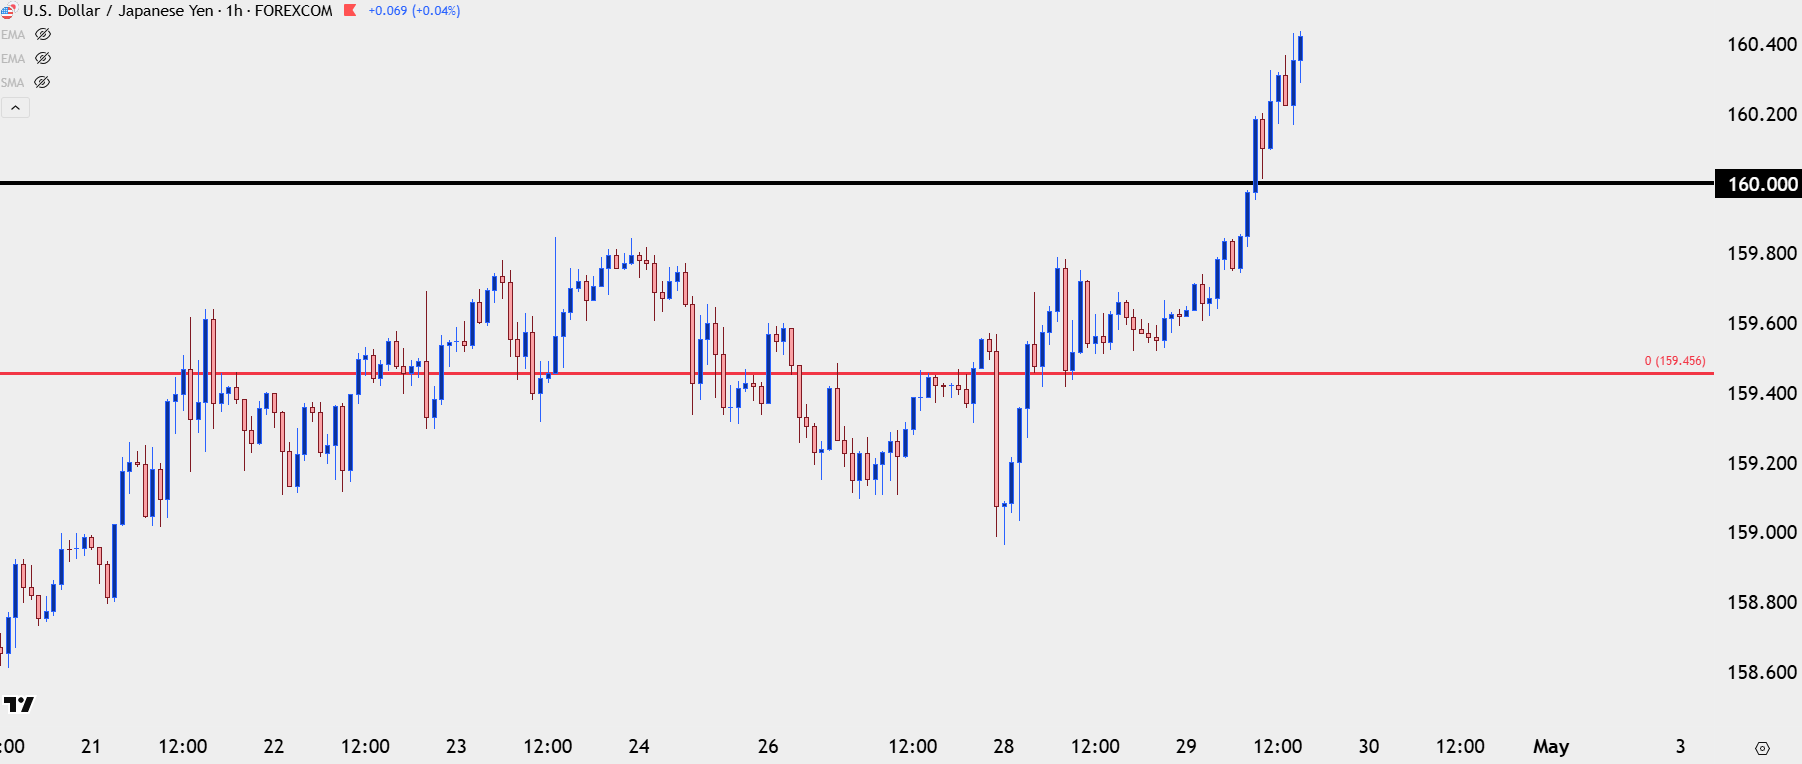
Chart prepared by James Stanley; data derived from Tradingview
EUR/USD
In a world where monetary policy has become well-telegraphed as central bankers fear creating more volatility from surprises than they’d want to deal with, there’s been several scenarios of ‘rate hike sell-offs’ or ‘rate cut rallies’ than one might expect. And given the expected hawkish lean from the ECB in the coming months the fact that the EUR/USD pair hasn’t been able to hold a bid speaks to that counter-intuitive nature. But, the fact of the matter is that it’s not just near-term rate expectations that push currencies, it’s also implications around longer-term trajectories. And if we are sitting in a space where higher oil prices bring the prospect of more inflation to the US economy, well, that could lead to higher rates down the road and the factoring in of that risk will have an impact on market prices.
In EUR/USD, hope is not necessarily lost for bulls as prices are angling down for re-test of a key zone, spanning from 1.1628-1.1655. This was resistance for about a month until the April breakout, and it hasn’t yet been re-tested as support. This could be a key decision point particularly if we see that weakness continue, followed by some jolt of reversal (perhaps from a Bank of Japan intervention threat or something of that ilk).
EUR/USD Daily Price Chart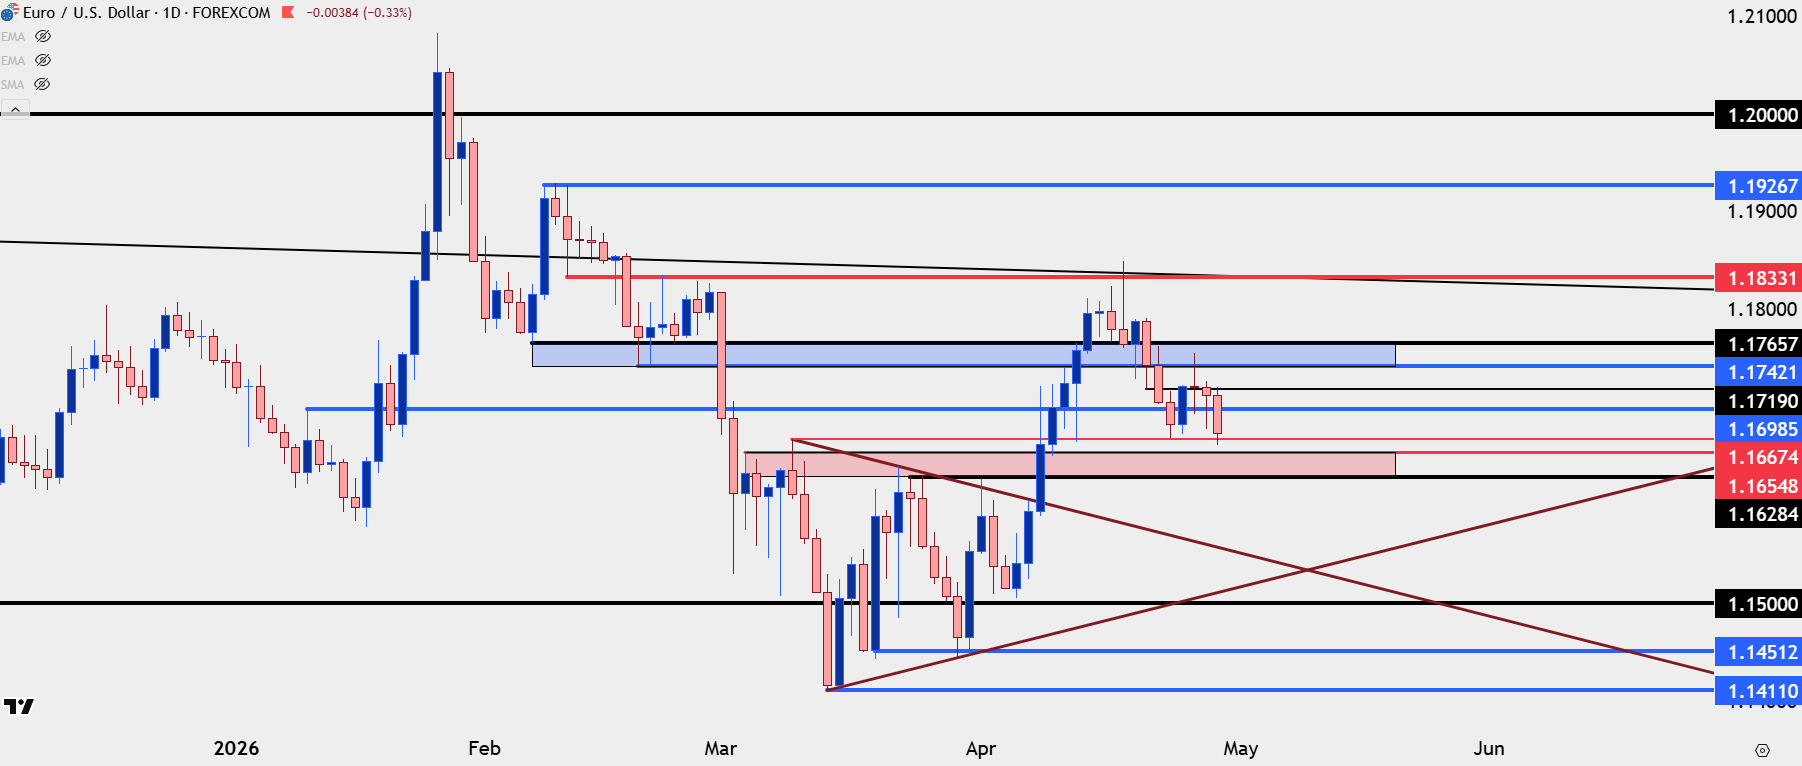
Chart prepared by James Stanley; data derived from Tradingview
GBP/USD
The Bank of England may be hiking more than once into this year as expectations have built for an active BoE later in the year. British bond yields have been jumping, as well, but so far this week Cable has been in a state of retreat. There’s a couple of different scenarios to entertain here, with the first being similar to the above in EUR/USD, where there’s a key support zone a little lower. In GBP/USD, that’s from around 1.3414-1.3434.
But – if we don’t get the larger pullback, GBP/USD has held up a bit better than EUR/USD so far as we have price holding above last Thursday’s swing lows which can’t quite be said about the Euro.
In GBP/USD, it’s all about the 1.3500 level and whether bulls can prod a bounce above that key price. If they can, the door opens for re-test of 1.3568 and then the 1.3600 handle that held cleanly on the prior test.
GBP/USD Four-Hour Price Chart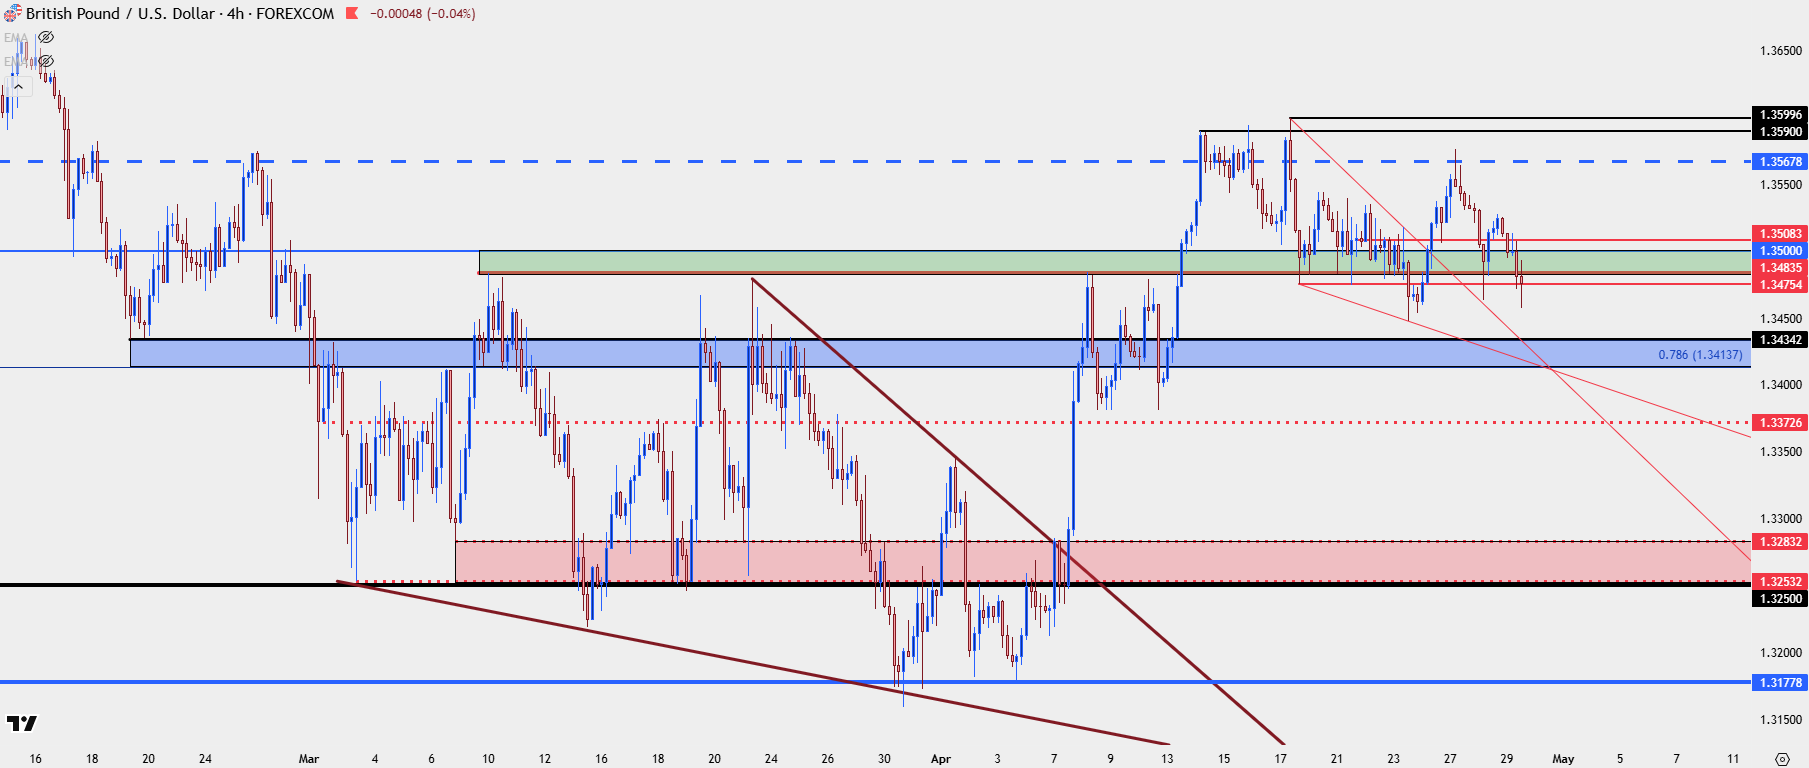
Chart prepared by James Stanley; data derived from Tradingview
--- written by James Stanley, Senior Market Analyst, Global Macro






