



VIX Breakout Flashes Warning Signal for Wall Street
The VIX has gapped higher after weeks of subdued volatility, raising questions over whether Wall Street’s relentless rally is becoming vulnerable.
Share this:
Wall Street indices continue to rally with barely a pause, but the VIX is beginning to show early signs that sentiment may be shifting. While it is far too early to call a top in US equities, rising volatility expectations, stretched momentum indicators, and growing demand for VIX hedges suggest traders should at least approach the rally with greater caution. And if a reversal does emerge, the Dow Jones may offer the cleanest bearish setup of the major US indices.
View related analysis:
- How to Read the COT Report to Track Forex Market Sentiment
- US Dollar Coiling, USD/JPY Eyes Resistance Heading into US CPI
- FX Futures Positioning: USD Index, USD/JPY, USD/CAD | COT Report
- AUD/USD Outlook: Aussie Buoyant Ahead of Trump-Xi Summit
- ASX 200 Outlook: Range Trade Persists as Financials and Materials Stabilise
View related analysis:
- How to Read the COT Report to Track Forex Market Sentiment
- US Dollar Coiling, USD/JPY Eyes Resistance Heading into US CPI
- FX Futures Positioning: USD Index, USD/JPY, USD/CAD | COT Report
- AUD/USD Outlook: Aussie Buoyant Ahead of Trump-Xi Summit
- ASX 200 Outlook: Range Trade Persists as Financials and Materials Stabilise
VIX Warning Signals Emerge for Wall Street Indices
VIX Breakout Warning Flashes for US Indices
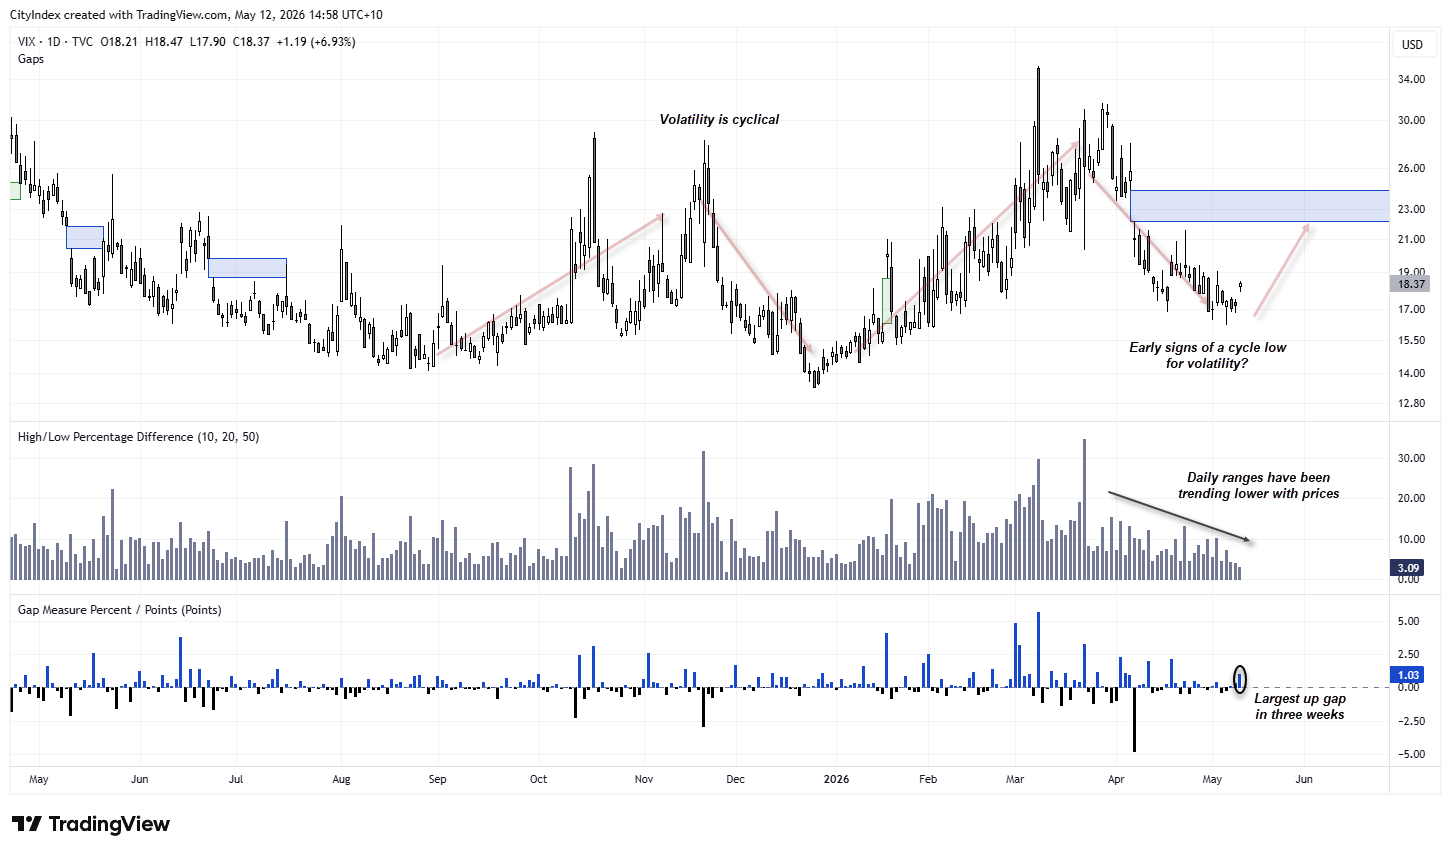
The spot volatility index (VIX) caught my eye today after gapping higher on Monday. While the one-point gap itself is not excessive, the fact it appeared following a consolidation phase just above 16 adds weight to the move in my view. Also note the two lower wicks ahead of the prior two days’ coiling price action, which further raises the risk of a shift in sentiment. Daily high-to-low ranges have also been trending lower since the March high. Add in the fact that volatility — and therefore the VIX — is cyclical and has been trending lower for the past two months, and the case for a pickup in volatility may be building. And if the VIX continues to rise, it usually spells trouble for Wall Street indices.
Source: TradingView


Volatility Index (VIX) Futures Positioning | COT Report
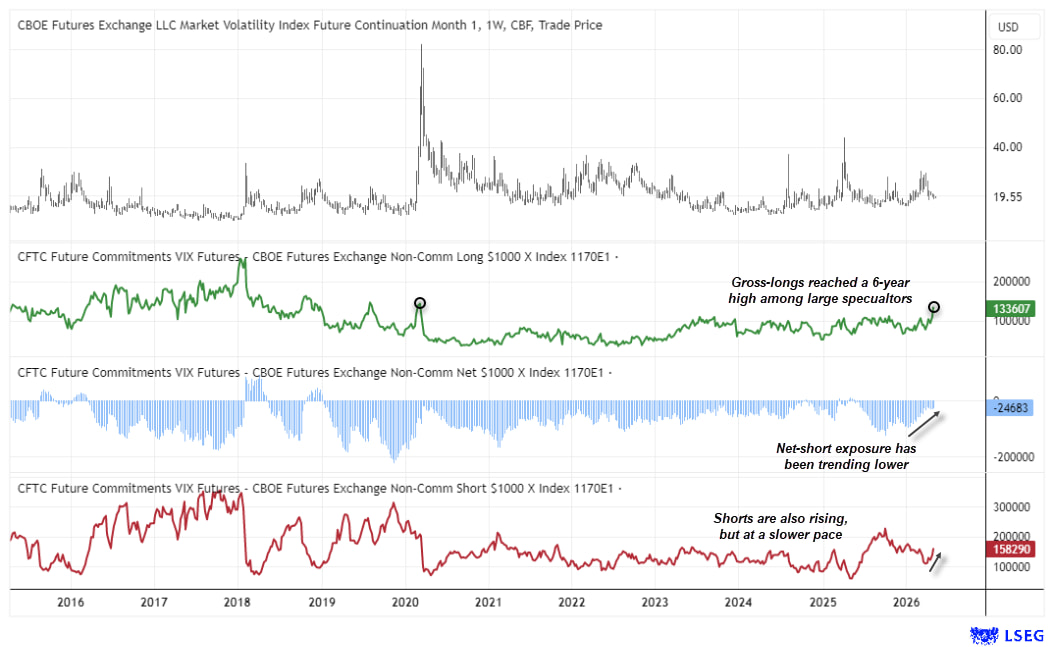
The weekly VIX futures chart highlights the cyclical nature of volatility and its tendency to eventually spike higher. Whether today’s US inflation report proves to be the catalyst remains to be seen. And the threat does not necessarily have to be immediate, as volatility troughs can take time to fully develop. However, when volatility does break higher, it tends to coincide with a more meaningful bout of risk-off sentiment.
Net-short exposure to VIX futures has been trending lower, suggesting less appetite among speculators to bet on subdued volatility. Gross-long exposure has also risen notably in recent weeks, with bullish bets climbing to their highest level since March 2020 at 133.6k contracts.
Source: CME, LSEG
Nasdaq and S&P 500 Extend Rally, but Dow Jones Looks Fragile
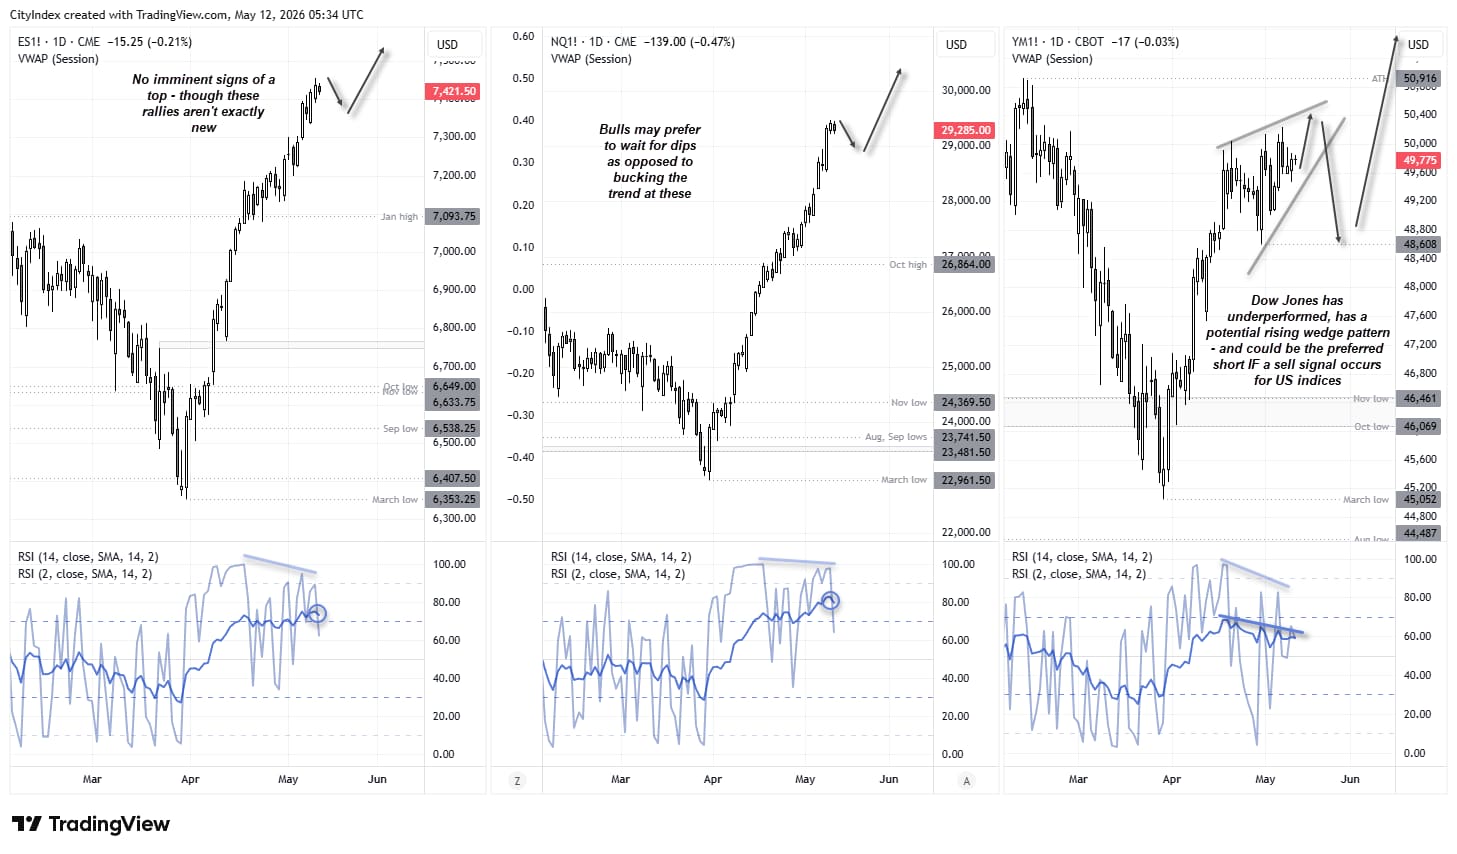
To say US indices have rallied strongly from their March lows would be an understatement. Nasdaq 100 futures have led the charge with a 28.4% gain, while the S&P 500 follows with a 17.3% rise. Neither market has experienced much of a pullback, with prices effectively rising in a straight line. And with no obvious signs of a top just yet, it would be a gamble to short such momentum purely because the VIX has gapped higher.
Still, the signal from the VIX should at least encourage Wall Street bulls to view the rally with greater scrutiny. Bearish divergences have formed on the RSI (2) within overbought territory, while the RSI (14) is also overbought at the time of writing.


Dow Jones Looks Most Vulnerable if Wall Street Turns Lower
But if a sell signal were to emerge on US indices, the Dow Jones would be my preferred vehicle. The Dow has risen just 11.5% from its March low, and price action since mid-April has been choppy enough for a potential rising wedge — a bearish reversal pattern — to form. If confirmed, the wedge projects a downside target towards its cycle low of 38,608.
Source: CME, CBOT, TradingView
View the full economic calendar
View the full economic calendar
-- Written by Matt Simpson
Follow Matt on Twitter @cLeverEdge
How to trade with City Index
You can trade with City Index by following these four easy steps:
- Open an account, or log in if you’re already a customer
• Open an account in the UK
• Open an account in Australia
• Open an account in Singapore
- Search for the market you want to trade in our award-winning platform
- Choose your position and size, and your stop and limit levels
- Place the trade
Related tags:


Open an account in minutes
Experience award-winning platforms with fast and secure execution.
Economic calendar
Web Trader platform
Our sophisticated web-based platform is packed with features.
Related articles

S&P 500, Nasdaq 100 Claw Back But NVDA Cloud Looms Overhead
Last week was green for both the Nasdaq and S&P 500 but given the sell-off that led into that bounce there’s still a very real question as to whether bears still have a statement to make. And the NVDA situation presents a very real threat.


Nasdaq 100 forecast: Nvidia troubles put AI recovery into question
The recovery for major indices this week has helped repair much of the technical damage inflicted by last week’s sell-off, but the latest developments with Nvidia suggest investors are not quite ready to put the underlying risks behind them. The Nasdaq 100 led other US index futures lower overnight, with falls of around 0.8%.

ASX 200 Outlook: Sector Rotation Builds as Rally Nears Record High
The ASX 200 nears record highs as sector rotation gathers pace. Could the RBA be nearing peak rates, and will resistance at 9200 trigger a pullback?
The information on this web site is not targeted at the general public of any particular country. It is not intended for distribution to residents in any country where such distribution or use would contravene any local law or regulatory requirement. The information and opinions in this report are for general information use only and are not intended as an offer or solicitation with respect to the purchase or sale of any currency or CFD contract. All opinions and information contained in this report are subject to change without notice. This report has been prepared without regard to the specific investment objectives, financial situation and needs of any particular recipient. Any references to historical price movements or levels is informational based on our analysis and we do not represent or warranty that any such movements or levels are likely to reoccur in the future. While the information contained herein was obtained from sources believed to be reliable, author does not guarantee its accuracy or completeness, nor does author assume any liability for any direct, indirect or consequential loss that may result from the reliance by any person upon any such information or opinions.
Futures, Options on Futures, Foreign Exchange and other leveraged products involves significant risk of loss and is not suitable for all investors. Losses can exceed your deposits. Increasing leverage increases risk. Spot Gold and Silver contracts are not subject to regulation under the U.S. Commodity Exchange Act. Contracts for Difference (CFDs) are not available for US residents. Before deciding to trade forex, commodity futures, or digital assets, you should carefully consider your financial objectives, level of experience and risk appetite. Any opinions, news, research, analyses, prices or other information contained herein is intended as general information about the subject matter covered and is provided with the understanding that we do not provide any investment, legal, or tax advice. You should consult with appropriate counsel or other advisors on all investment, legal, or tax matters. References to FOREX.com or GAIN Capital refer to StoneX Group Inc. and its subsidiaries. Please read Characteristics and Risks of Standardized Options.