



WTI Crude, Gold: Fade the Spike or Respect the Regime Shift?
WTI and gold are higher as traders confront a fat left tail that is easy to describe but hard to price. A quick normalisation keeps the fade narrative alive. Sustained disruption changes the distribution quickly.
Share this:

- WTI crude and gold spike on open
- Hormuz disruption risk drives risk premium
- Gold volatility key to durability of the rally
Summary
Crude and gold have both spiked on the open as markets price the immediate shock. The key question now is durability. If flows through Hormuz begin to normalise, the move risks becoming a classic geopolitical fade. If disruption persists and gold strength is accompanied by a shift in the volatility regime, the market may be leaning into something more structural. The pain trade remains with those assuming quick containment.
Barrels are useless if they can’t move
Israel and the US have struck Iran, Tehran has retaliated, and for now the Strait of Hormuz is effectively shut with tankers anchored and insurers scrambling. Brent was already climbing and then surged again in OTC trade over the weekend, so by the time futures reopened there was already a decent risk premium in the price. The headlines are clear. What isn’t clear is whether the disruptions proves temporary or something more persistent.
OPEC+ agreed to lift output by 206,000 bpd from April, announced during a scheduled meeting over the weekend. In normal circumstances that would matter at the margin. Here, it feels largely symbolic and honestly irrelevant. Most of the spare capacity sits with Saudi Arabia, but even if Riyadh can pump more, it can’t easily ship it. Extra barrels on paper don’t help much if they can’t reach the market.
If the disruption lasts only a few days, higher maritime insurance and freight costs are noise rather than signal. Inventories can smooth it and risk premia embedded in the price can unwind quickly once flows resume. But if it stretches into weeks, the story changes fast. You are then talking about a meaningful slice of global supply offline, placing upward pressure on inflation expectations and delivering a genuine growth hit.
Energy markets confront escalation risk
Source: TradingView
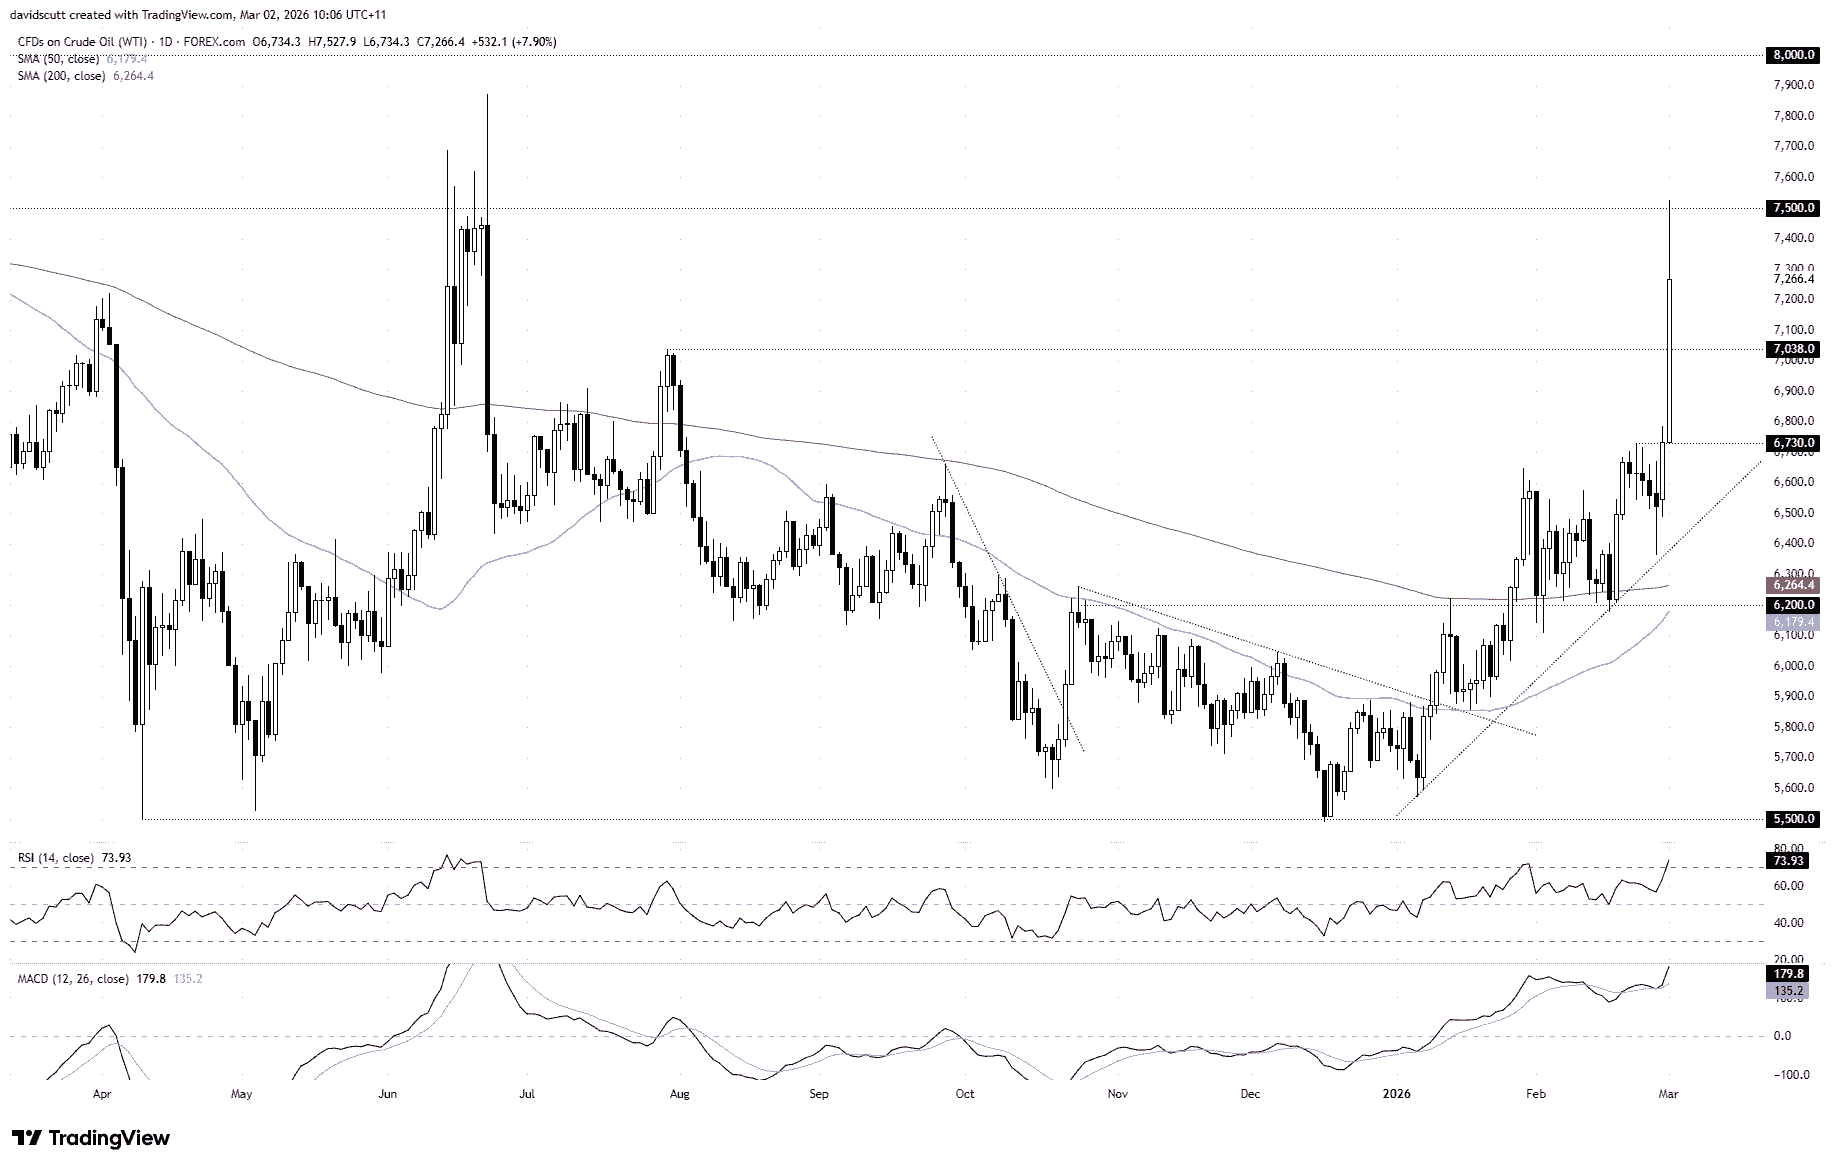
When you move into a geopolitical risk regime like this, technicals matter less than flows and headlines. Price can and will overshoot levels if the news warrants it. That said, the technical backdrop into the weekend was already improving. The price remained in an uptrend with bullish momentum building.
From here, it’s more about knowing where the obvious reference points sit overhead. The first is the July 2025 swing high at $70.38. Above that, the more interesting zone starts just north of $75. That area repeatedly capped bullish raids when Israel struck Iran last year. Price traded as high as $78.70 during that episode but never managed to secure a close above $75. That makes it a clear line in the sand.
If that zone gives way on a sustained basis, $80 and $84 come into view quickly, followed by the April 2024 swing high at $87.29. In a contained scenario, those levels may simply act as magnets for profit-taking. In a sustained disruption scenario, they become stepping stones to higher levels.
Gold reaction may reveal conviction
Oil will drive the inflation narrative, but gold may give the cleaner read on how seriously markets are treating the risk. Crude is hostage to physical flows and shipping constraints. Gold is about confidence, positioning and volatility. If this is a short-lived shock, bullion strength may struggle to stick. If it builds and holds, that’s when you start thinking the market is leaning into something more persistent.
Source: TradingView
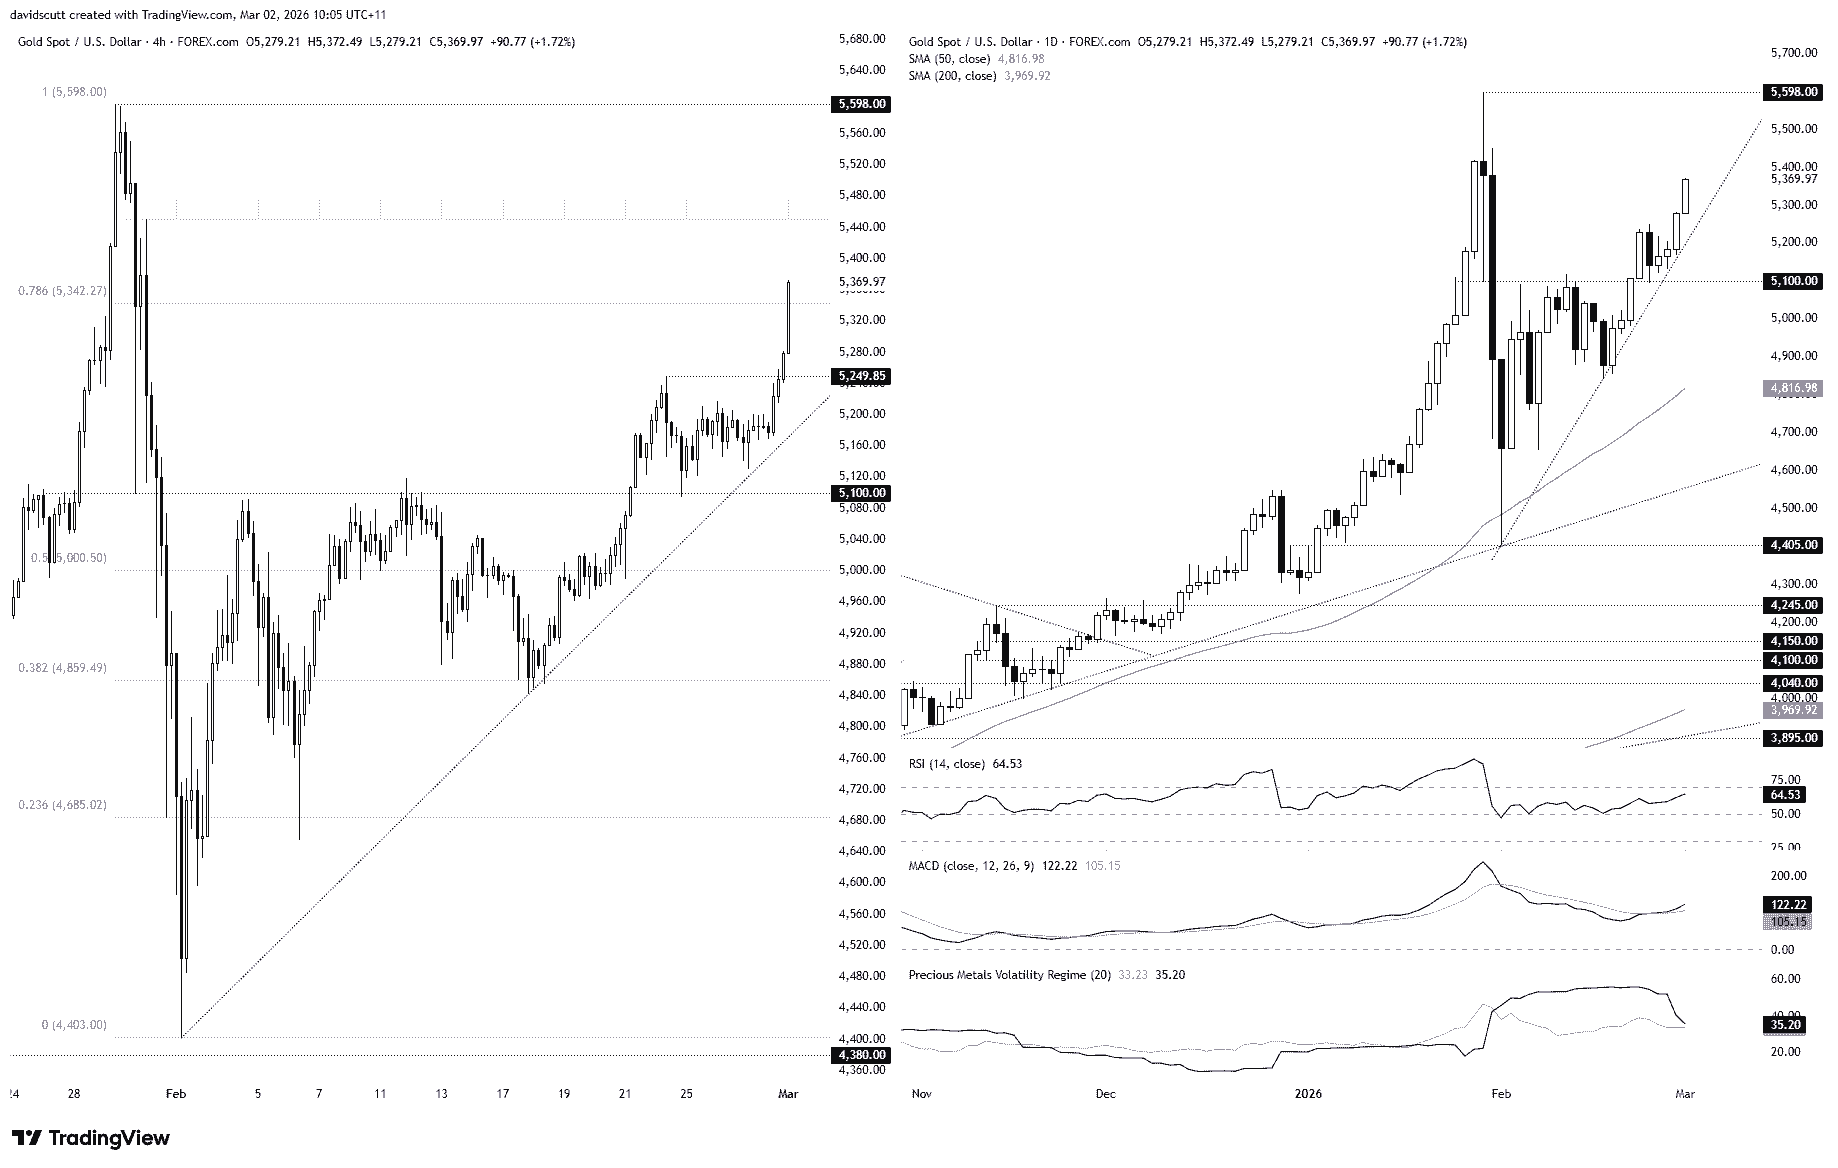
On the daily chart on the right, the bigger picture was already constructive before the weekend. Price is well above the 50 and 200-day moving averages, both sloping higher, with RSI pushing north and MACD positive having staged a bullish crossover. Gold didn’t need a geopolitical shock to rally. It was already trending higher.
But in this kind of backdrop, technicals are secondary. The volatility regime probably matters more. Shown in the bottom pane, realised volatility in black is still above implied in grey. If realised jumps more on the open, that suggests reactive price action. If implied pushes above realised and stays there, that’s when rallies have tended to become more durable in the recent past.
The four-hourly chart on the left gives you something of a roadmap. $5,342 is the 78.6% retracement of the January–February move and the first level overhead of note. Above that, there’s a minor resistance zone between $5,450 and $5,475. Then it’s the record high at $5,598. In a contained scenario, those are areas where price may stall. If this proves more persistent, they’re simply levels to clear on the way through.
Latest market news




Open an account in minutes
Experience award-winning platforms with fast and secure execution.
Economic calendar
Web Trader platform
Our sophisticated web-based platform is packed with features.
Related articles
Australian Dollar Forecast: AUD/USD Breaks Multi-Month Range, Hits 10-Month Low 11 14 2026
Aussie bears are closing in on major technical support, with next week's Australian employment data raising the stakes for a pivotal reaction.

USD/JPY Weekly Outlook: Bulls Eye Higher Range After Historic Rate Shock
A historic US rate shock has sent USD/JPY above 160, but with intervention risks rising and few major economic catalysts ahead, AI sentiment could hold the key to the next move.
Nvidia Earnings Preview: NVDA’s First Test of the Post Jenson Huang Era
Nvidia is expected to report $2.47 in EPS on $108.8B in revenue this quarter, but investors will be more interested in the company's guidance after the unexpected departure of founder and CEO Jenson Huang.

The information on this web site is not targeted at the general public of any particular country. It is not intended for distribution to residents in any country where such distribution or use would contravene any local law or regulatory requirement. The information and opinions in this report are for general information use only and are not intended as an offer or solicitation with respect to the purchase or sale of any currency or CFD contract. All opinions and information contained in this report are subject to change without notice. This report has been prepared without regard to the specific investment objectives, financial situation and needs of any particular recipient. Any references to historical price movements or levels is informational based on our analysis and we do not represent or warranty that any such movements or levels are likely to reoccur in the future. While the information contained herein was obtained from sources believed to be reliable, author does not guarantee its accuracy or completeness, nor does author assume any liability for any direct, indirect or consequential loss that may result from the reliance by any person upon any such information or opinions.
Futures, Options on Futures, Foreign Exchange and other leveraged products involves significant risk of loss and is not suitable for all investors. Losses can exceed your deposits. Increasing leverage increases risk. Spot Gold and Silver contracts are not subject to regulation under the U.S. Commodity Exchange Act. Contracts for Difference (CFDs) are not available for US residents. Before deciding to trade forex, commodity futures, or digital assets, you should carefully consider your financial objectives, level of experience and risk appetite. Any opinions, news, research, analyses, prices or other information contained herein is intended as general information about the subject matter covered and is provided with the understanding that we do not provide any investment, legal, or tax advice. You should consult with appropriate counsel or other advisors on all investment, legal, or tax matters. References to FOREX.com or GAIN Capital refer to StoneX Group Inc. and its subsidiaries. Please read Characteristics and Risks of Standardized Options.