




Asian Open: Wall Street broadly lower amidst volatile trade
Another volatile start to the week saw equities continue to plunge, wild price swings across commodities markets and the US regain its safe-haven bid.
Share this:

Monday US cash market close:
- The Dow Jones Industrial fell -797.42 points (-2.37%) to close at 32,817.38
- The S&P 500 index rose -127.78 points (2.51%) to close at 34,058.75
- The Nasdaq 100 index fell -518.449 points (-3.75%) to close at 13,319.38
Asian futures:
- Australia's ASX 200 futures are down -84.5 points (-1.19%), the cash market is currently estimated to open at 6,954.10
- Japan's Nikkei 225 futures are down -170 points (-0.67%), the cash market is currently estimated to open at 25,051.41
- Hong Kong's Hang Seng futures are up 26 points (0.12%), the cash market is currently estimated to open at 21,083.63
- China's A50 Index futures are down -58 points (-0.42%), the cash market is currently estimated to open at 13,846.27

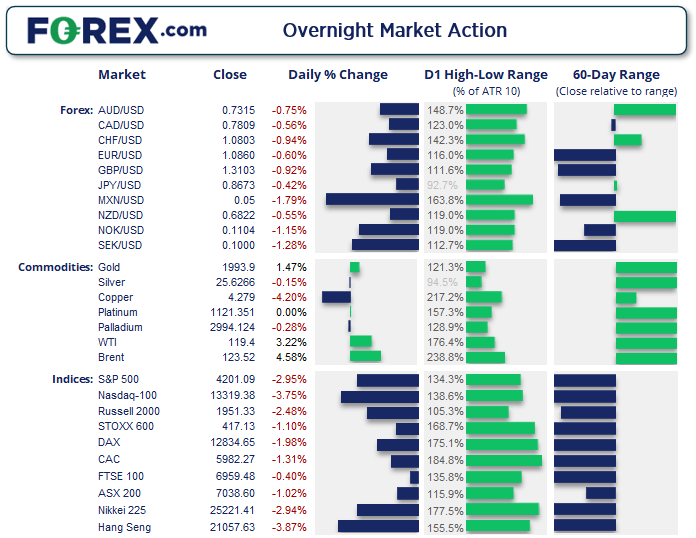
The equity markets selloff which began in Asia swiftly made its way through the European and US session, with all major benchmarks and cyclical sectors in the red. Ultimately, fears of stagflation were reignited as oil prices ‘on fire’ which saw investors rush for the exit.
A couple of key milestones were achieved, with the Dow Jones entering a technical correction as it fallen over -10% from its record high, and the DAX entered a technical bear market having fallen over -20% from its own record high. On a closing basis, the Nasdaq 100 is just 0.02% from confirming its own bear market.
ASX 200:
75% of the ASX 200 stocks declined yesterday, although energy stocks were a clear winner as they tracked oil prices higher. The sector rallied over 5% yesterday during its most bullish session since November 2020 and rose to a post-pandemic high.
But it’s not clear they will continue higher today. But with Western leaders umming and ahing over whether they really will try to embargo Russia oil, WTI gave back most of its earlier gains and it’s likely to see the energy sector struggle today. And the weak lead from Wall Street and AXS futures pointing lower, a break and hold below 7,000 today is could also on the cards for the ASX 200.

ASX 200: 7038.6 (-1.02%), 07 March 2022
- Energy (5.25%) was the strongest sector and Information Technology (-4.68%) was the weakest
- 2 out of the 11 sectors closed higher
- 9 out of the 11 sectors closed lower
- 4 out of the 11 sectors outperformed the index
- 41 (20.50%) stocks advanced, 151 (75.50%) stocks declined
Outperformers:
- 12.26% - Coronado Global Resources Inc (CRN.AX)
- 9.52% - Woodside Petroleum Ltd (WPL.AX)
- 7.08% - Zimplats Holdings Ltd (ZIM.AX)
Underperformers:
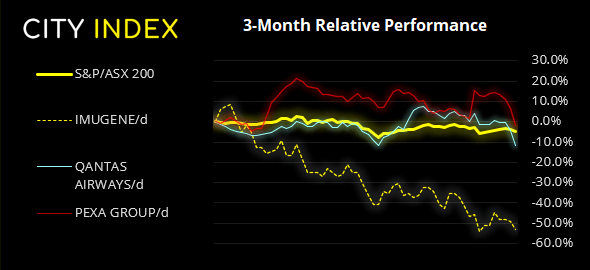
- -8.16% - Imugene Ltd (IMU.AX)
- -7.93% - Qantas Airways Ltd (QAN.AX)
- -7.52% - PEXA Group Ltd (PXA.AX)
Volatile trade for commodities
London Nickel prices rose over 67% yesterday and the London gas and oil futures contract was up over 8%, on concerns of an energy supply disruptions via embargoes. And UK PM’s comments that they may need increase oil and gas production as they wean themselves off of Russian energy suggests this may be a slow process to adjust, which is further supporting London pricing.
WTI futures rose close to 13% at yesterday’s open and traded above $130 before pulling back to $120. Brent Heating futures printed an intraday record high and gained over 10% by the close.
Key metals such as palladium, platinum and copper tracked oil prices higher and then lower. Palladium hit a record high but trades just beneath its open, and copper printed a bearish outside day after tapping $5 for the first time in history.
Gold bucked the metals trend and held onto most of the day’s gains, trades just below $2000 after tapping it earlier in the session and appears set to test its record high.
US dollar reclaims safe-haven flows
The US dollar was top of the leader board yesterday, rising against all other FX majors. EUR/USD fell to a 22-month low, GBP/USD hit a 16-month low, and even AUD and NZD traded lower by the close despite posting strong gains earlier in the day. Looking across the Aussie pairs, they’ve had an epic run but it now appears set for at least a pause in trend, if not a corrective phase.
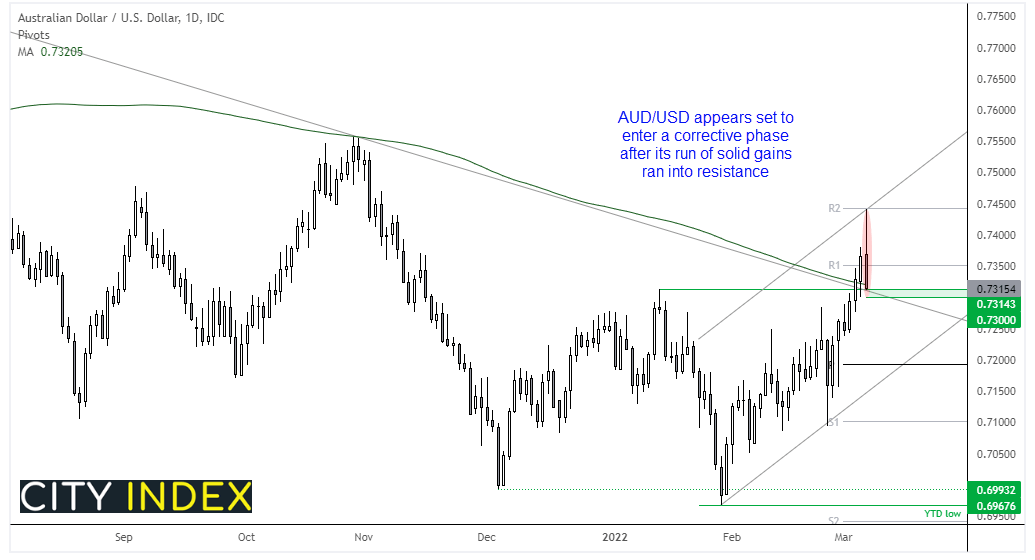

AUD/USD had risen nearly 7% from its YTD low by yesterday’s high, which met resistance at the monthly R2 pivot and upper trend channel. Moreover, being an elongated bearish engulfing candle, it could be a key reversal which closed below its 200-day MA. At the very least this serves as a warning for bulls to tread carefully, tighten stops of step aside. But a break below 0.7300 would take it back beneath its broken trendline and be of interest for countertrend traders.
Read our guide on the Australian Dollar
Read our guide on the Australian Dollar
Up Next (Times in AEDT)
How to trade with City Index
You can easily trade with City Index by using these four easy steps:
- Open an account, or log in if you’re already a customer
• Open an account in the UK
• Open an account in Australia
• Open an account in Singapore
- Search for the company you want to trade in our award-winning platform
- Choose your position and size, and your stop and limit levels
- Place the trade
How to trade with FOREX.com
Follow these easy steps to start trading with FOREX.com today:
- Open a Forex.com account, or log in if you’re already a customer.
- Search for the pair you want to trade in our award-winning platform.
- Choose your position and size, and your stop and limit levels.
- Place the trade.
Related tags:
Latest market news




Open an account in minutes
Experience award-winning platforms with fast and secure execution, and enjoy tight spreads from 0.5 pts on FX and 0.3 pts on indices.
Economic calendar
Web Trader platform
Our sophisticated web-based platform is packed with features.
Related articles
USD/MXN Analysis: Is Super Peso Starting to Fade?
Over recent trading sessions, the Mexican peso has continued to show signs of weakness against the U.S. dollar. This can already be seen in USD/MXN, which has gained more than 1.7% over the last three sessions, highlighting sustained buying pressure in favor of the dollar in the short term.
Canadian Dollar Analysis: USD/CAD Returns to July Highs Ahead of NFP
The Canadian dollar continues to face one of its most challenging environments in recent months when it comes to maintaining strength against the U.S. dollar. The weakness of the Canadian currency is clearly reflected in USD/CAD, which has now recorded nine consecutive bullish sessions and gained more than 1.7% during that period.
Gold Price Forecast: XAU/USD Plunges 12.4% Toward Critical Support 10 1 2026
Softer inflation has revived expectations for a Fed pause, but Friday’s payrolls could put gold’s recovery prospects to the test.

This report is intended for general circulation only. It should not be construed as a recommendation, or an offer (or solicitation of an offer) to buy or sell any financial products. The information provided does not take into account your specific investment objectives, financial situation or particular needs. Before you act on any recommendation that may be contained in this report, independent advice ought to be sought from a financial adviser regarding the suitability of the investment product, taking into account your specific investment objectives, financial situation or particular needs.
StoneX Financial Pte. Ltd., may distribute reports produced by its respective foreign entities or affiliates within the StoneX group of companies or third parties pursuant to an arrangement under Regulation 32C of the Financial Advisers Regulations. Where the report is distributed to a person in Singapore who is not an accredited investor, expert investor or an institutional investor (as defined in the Securities Futures Act), StoneX Financial Pte. Ltd. accepts legal responsibility to such persons for the contents of the report only to the extent required by law. Singapore recipients should contact StoneX Financial Pte. Ltd. at 6826 9988 for matters arising from, or in connection with the report.
In the case of all other recipients of this report, to the extent permitted by applicable laws and regulations neither StoneX Financial Pte. Ltd. nor its associated companies will be responsible or liable for any loss or damage incurred arising out of, or in connection with, any use of the information contained in this report and all such liability is hereby expressly disclaimed. No representation or warranty is made, express or implied, that the content of this report is complete or accurate.
StoneX Financial Pte. Ltd. is not under any obligation to update this report.
Trading CFDs carries a high level of risk that may not be suitable for some investors. Consider your investment objectives, level of experience, financial resources, risk appetite and other relevant circumstances carefully. The possibility exists that you could lose some or all of your investments, including your initial deposits. If in doubt, please seek independent expert advice. Visit www.forex.com/en-sg/terms-and-policies for the complete Risk Disclosure Statement.