



AU employment miss adds to the Aussie's woes
A weak lead form Wall Street weighed on the Aussie overnight, with today’s employment miss adding to its downside pressure.
Share this:

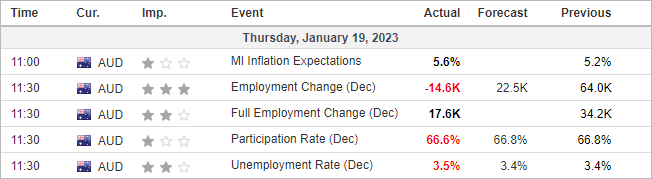
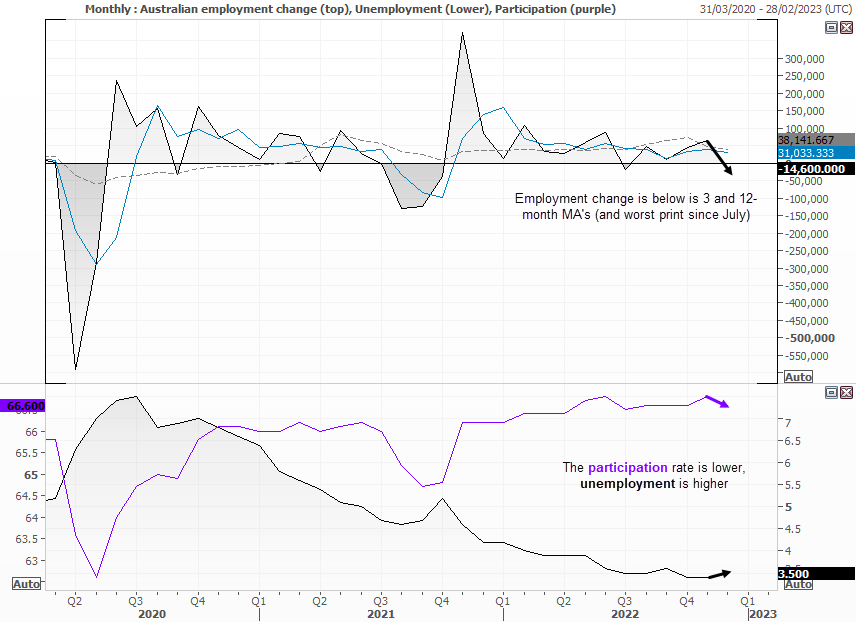
Finally - an interesting employment report arrives for Australia, which could be good for traders but less so for the economy. We have three ‘misses’ with employment change and the participation rate below expectations and the unemployment rate above.
The standout figure is employment falling -14.6k, which is its worst since July and below its 3 and 12-month averages of 38.1k and 31.1k respectively. It’s unlikely to derail the RBA from another 25bp hike in February (especially with inflation continuing to rise) but the RBA will keep a close eye on employment change and unemployment to see if it is the beginning of a trend.
For now, the weak lead form Wall Street - which toppled commodity FX overnight – today’s employment figures are another reason to sell the Aussie, following its rally of the past three months.
AUD/USD daily chart:
There’s a few things to cover here but it al ties in to a pullback for the Aussie (in my humble opinion). It’s had a better-than-expected rally since the October low, which has stalled at the August highs as of yesterday, with a bearish engulfing hammer. The fact the candle high did not even touch the resistance zone and failed to hold above 0.7000 hints at a potential top. And the fact that we have a 2-month bearish divergence with the RSI (14) and that the AU-US 2yr yield spread remains relatively low compared to the Aussie’s rally provides more conviction for a pullback in my view.
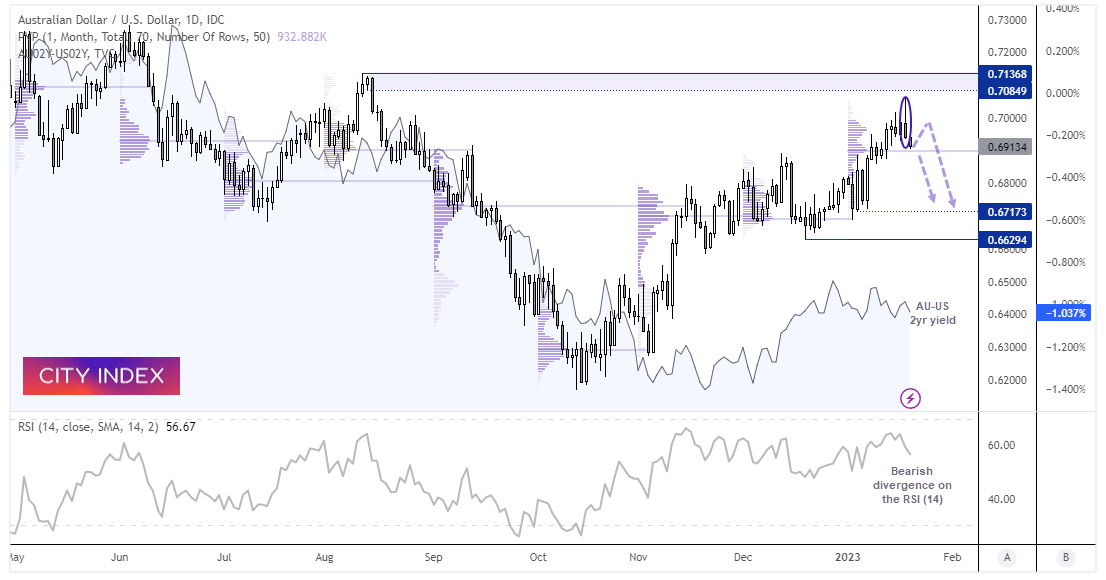
However, notice that today’s lows area holding above last week’s VPOC (volume point of control) which may continue to provide some support for now. Ultimately my bias is bearish beneath yesterday’s high, and would consider fading into rallied within yesterday’s candle. Also keep an eye on the S&P 500 as the Aussie is tracking it quite well at the moment, so we would like to see the S&P also roll over as outlined in this TradingView article.
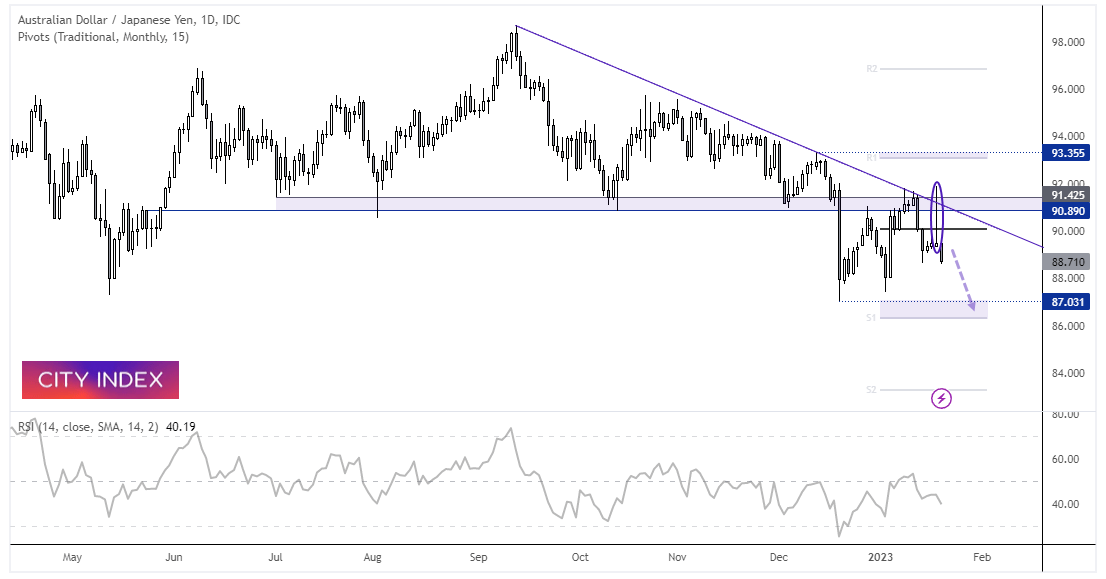
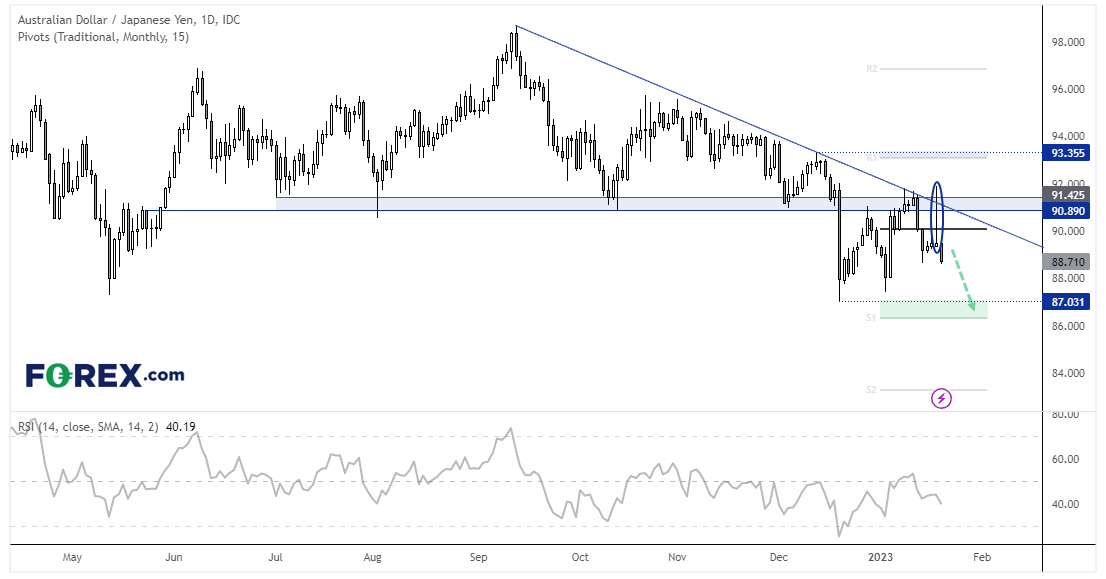
AUD/JPY daily chart:
We noted yesterday that AUD/JPY was trying to close above 92.0 yesterday following the BOJ meeting – but alas it was not to be. Weak US data saw money flow back into the yen and crush AUD, USD and CAD pairs and AUD/JPY to hand back all of its BOJ gains.
The long bearish Pinbar – which failed to hold above an important resistance cluster is also important as it shows a potential swing high. Should sentiment remain risk-off overall, then we suspect AUD/JPY could be headed for the lows around 0.87.
Related tags:
Latest market news




Open an account in minutes
Experience award-winning platforms with fast and secure execution, and enjoy tight spreads from 0.5 pts on FX and 0.3 pts on indices.
Economic calendar
Web Trader platform
Our sophisticated web-based platform is packed with features.
Related articles
Silver's bullish breakout case builds as bond yields retreat
The Democratic blue wave has sent crude and Treasury yields sharply lower, improving the outlook for precious metals. With gold already breaking higher, could silver be next?
Gold Reclaims $4,000, Bulls Eye Reversal with Seasonality Tailwind
Gold futures rebound above $4,000 as falling US yields, improving sentiment and bullish seasonality raise hopes of a significant reversal.
GBP/USD, GBP/AUD: Sterling Rally Faces a BoE Reality Check
Sterling faces a reality check as the BoE prepares to hike rates. GBP/USD and GBP/AUD approach resistance, leaving bulls vulnerable to dovish guidance.
This report is intended for general circulation only. It should not be construed as a recommendation, or an offer (or solicitation of an offer) to buy or sell any financial products. The information provided does not take into account your specific investment objectives, financial situation or particular needs. Before you act on any recommendation that may be contained in this report, independent advice ought to be sought from a financial adviser regarding the suitability of the investment product, taking into account your specific investment objectives, financial situation or particular needs.
StoneX Financial Pte. Ltd., may distribute reports produced by its respective foreign entities or affiliates within the StoneX group of companies or third parties pursuant to an arrangement under Regulation 32C of the Financial Advisers Regulations. Where the report is distributed to a person in Singapore who is not an accredited investor, expert investor or an institutional investor (as defined in the Securities Futures Act), StoneX Financial Pte. Ltd. accepts legal responsibility to such persons for the contents of the report only to the extent required by law. Singapore recipients should contact StoneX Financial Pte. Ltd. at 6826 9988 for matters arising from, or in connection with the report.
In the case of all other recipients of this report, to the extent permitted by applicable laws and regulations neither StoneX Financial Pte. Ltd. nor its associated companies will be responsible or liable for any loss or damage incurred arising out of, or in connection with, any use of the information contained in this report and all such liability is hereby expressly disclaimed. No representation or warranty is made, express or implied, that the content of this report is complete or accurate.
StoneX Financial Pte. Ltd. is not under any obligation to update this report.
Trading CFDs carries a high level of risk that may not be suitable for some investors. Consider your investment objectives, level of experience, financial resources, risk appetite and other relevant circumstances carefully. The possibility exists that you could lose some or all of your investments, including your initial deposits. If in doubt, please seek independent expert advice. Visit www.forex.com/en-sg/terms-and-policies for the complete Risk Disclosure Statement.