



Australian Dollar Outlook: AUD/USD Range Offers Traders a Tactical Blueprint
The Aussie may look dull, but its respect for technicals is a gift. If you know the blueprint, you know where the next trade could come from.
Share this:

- Fundamentals aren’t moving the Aussie
- Global uncertainty keeps traders cautious
- Fed cut and local CPI dominate focus
- AUD pairs respecting known levels
AUD Outlook Summary
Fundamental drivers aren’t really impacting the Australian dollar right now. There’s plenty of uncertainty around how the Trump–Xi meeting will play out, risk assets look stretched but haven’t delivered a significant drawdown yet, and the Fed is expected to cut rates next week regardless of tomorrow’s inflation report. Locally, the looming release of Australia’s inflation data next Wednesday has kept many rates traders on the sidelines. Whether against the U.S. dollar or crosses, the Aussie feels listless. That probably explains why it’s been so respectful of known levels over the past week. It may not be the most exciting FX name, but if that remains the case, it gives traders a clear blueprint for assessing setups.
AUD/USD Rangebound, Risks Tilting Lower
Source: TradingView
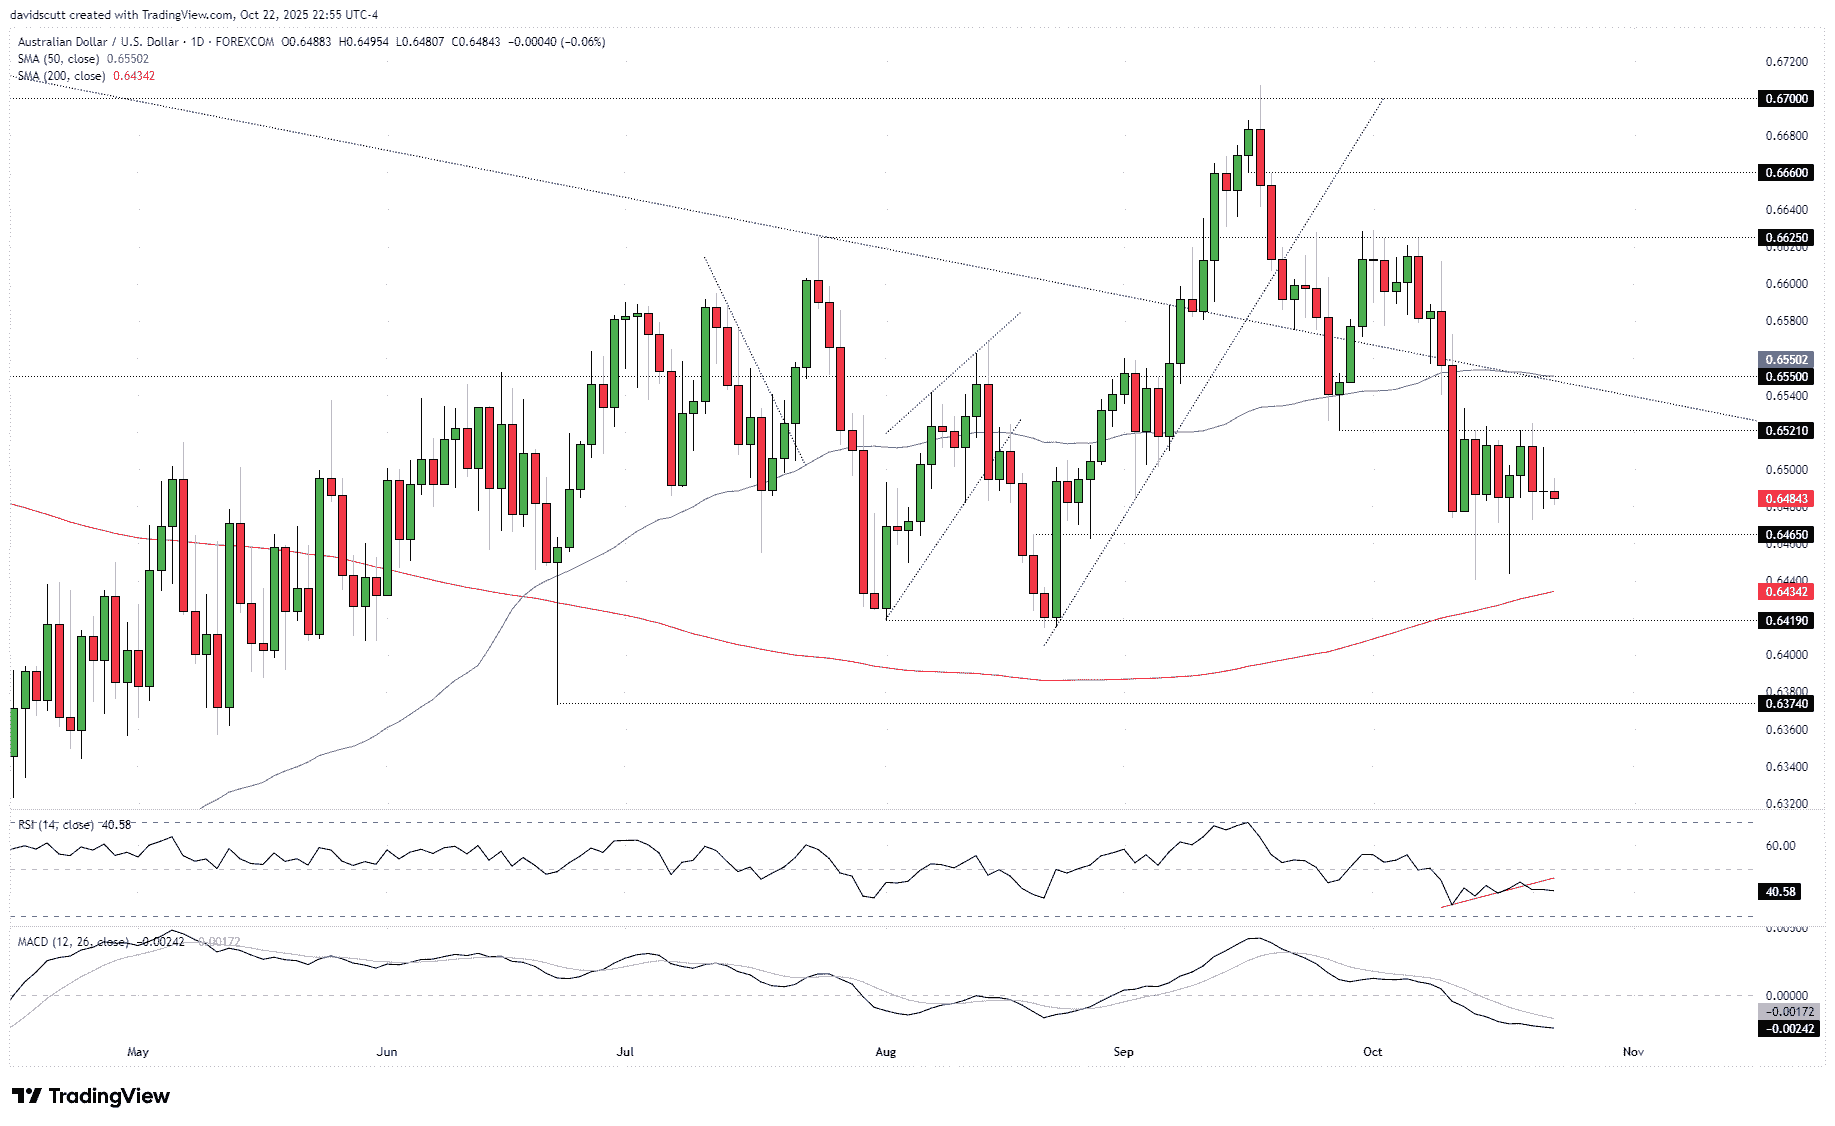
AUD/USD has resembled a game of pong recently, attracting offers above .6521 while bids are layered beneath .6480. That’s the initial range traders need to be aware of when looking at the pair. While there is no obvious directional signal from moving averages with the price sandwiched between the 50-day above and 200-day below, momentum indicators offer a little more with RSI (14) breaking its uptrend while remaining below 50 while MACD continues to push into negative territory having already crossed the signal line, providing an overall message of sustained downside pressure. That favours a bearish bias even if it’s not a slam dunk case.
The last two daily candles prior to Thursday point to a growing risk of a downside break, with a bearish bar from .6521 resistance followed by a tombstone doji. If the price were to break and close beneath minor support at .6465, it may encourage additional bears off the sideline seeking a retest of the double bottom around .6400, which is where the 200-day moving average is found. Beyond, .6419 and the June low of .6374 are other downside levels of note.
While it screens as a lower probability play, should the offers above .6521 be overrun, the intersection of the 50-day moving average, horizontal resistance at .6550 and downtrend from the 2021 highs would prove a stern test for longs. If it were to be broken, .6625 resistance would be next item on the menu for bulls.


EUR/AUD: Price Signals take Precedence
Source: TradingView
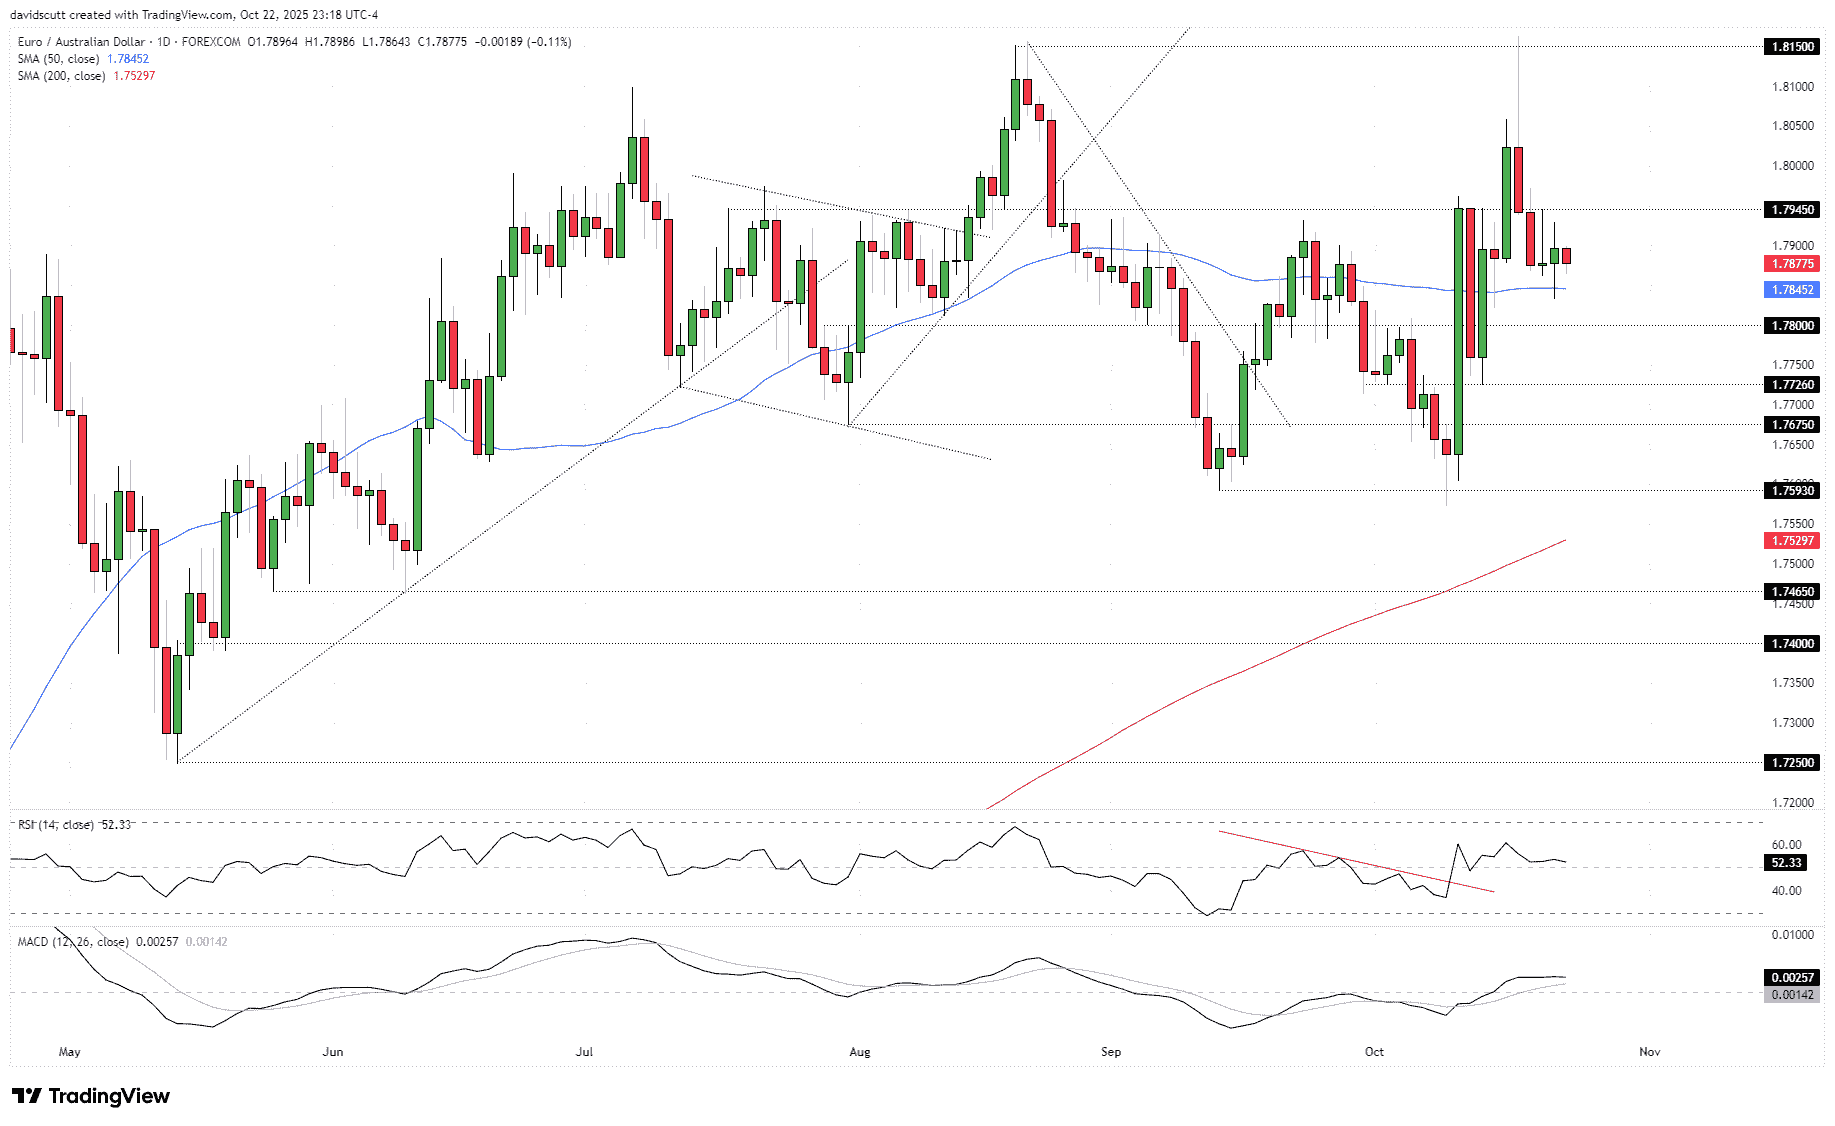
EUR/AUD has been similarly respectful of levels over the past month, with 1.7945 the latest focal point. It’s capped the price in each of the past two sessions, providing bears with an entry level if they want it.
Below these levels, the 50-day moving average has offered support over the past fortnight, making it a downside target or entry point for longs. Beyond, 1.7800 has seen plenty of price action recently, with 1.7726 and 1.7675 other notable levels. Above 1.7945, 1.8050 and 1.8150 have attracted sellers over recent months.
Momentum is essentially neutral, even if RSI (14) and MACD lean marginally bullish. In this rangy environment, price action deserves more weight than momentum signals.
GBP/AUD: Failed Bearish Break Offers Clues
Source: TradingView
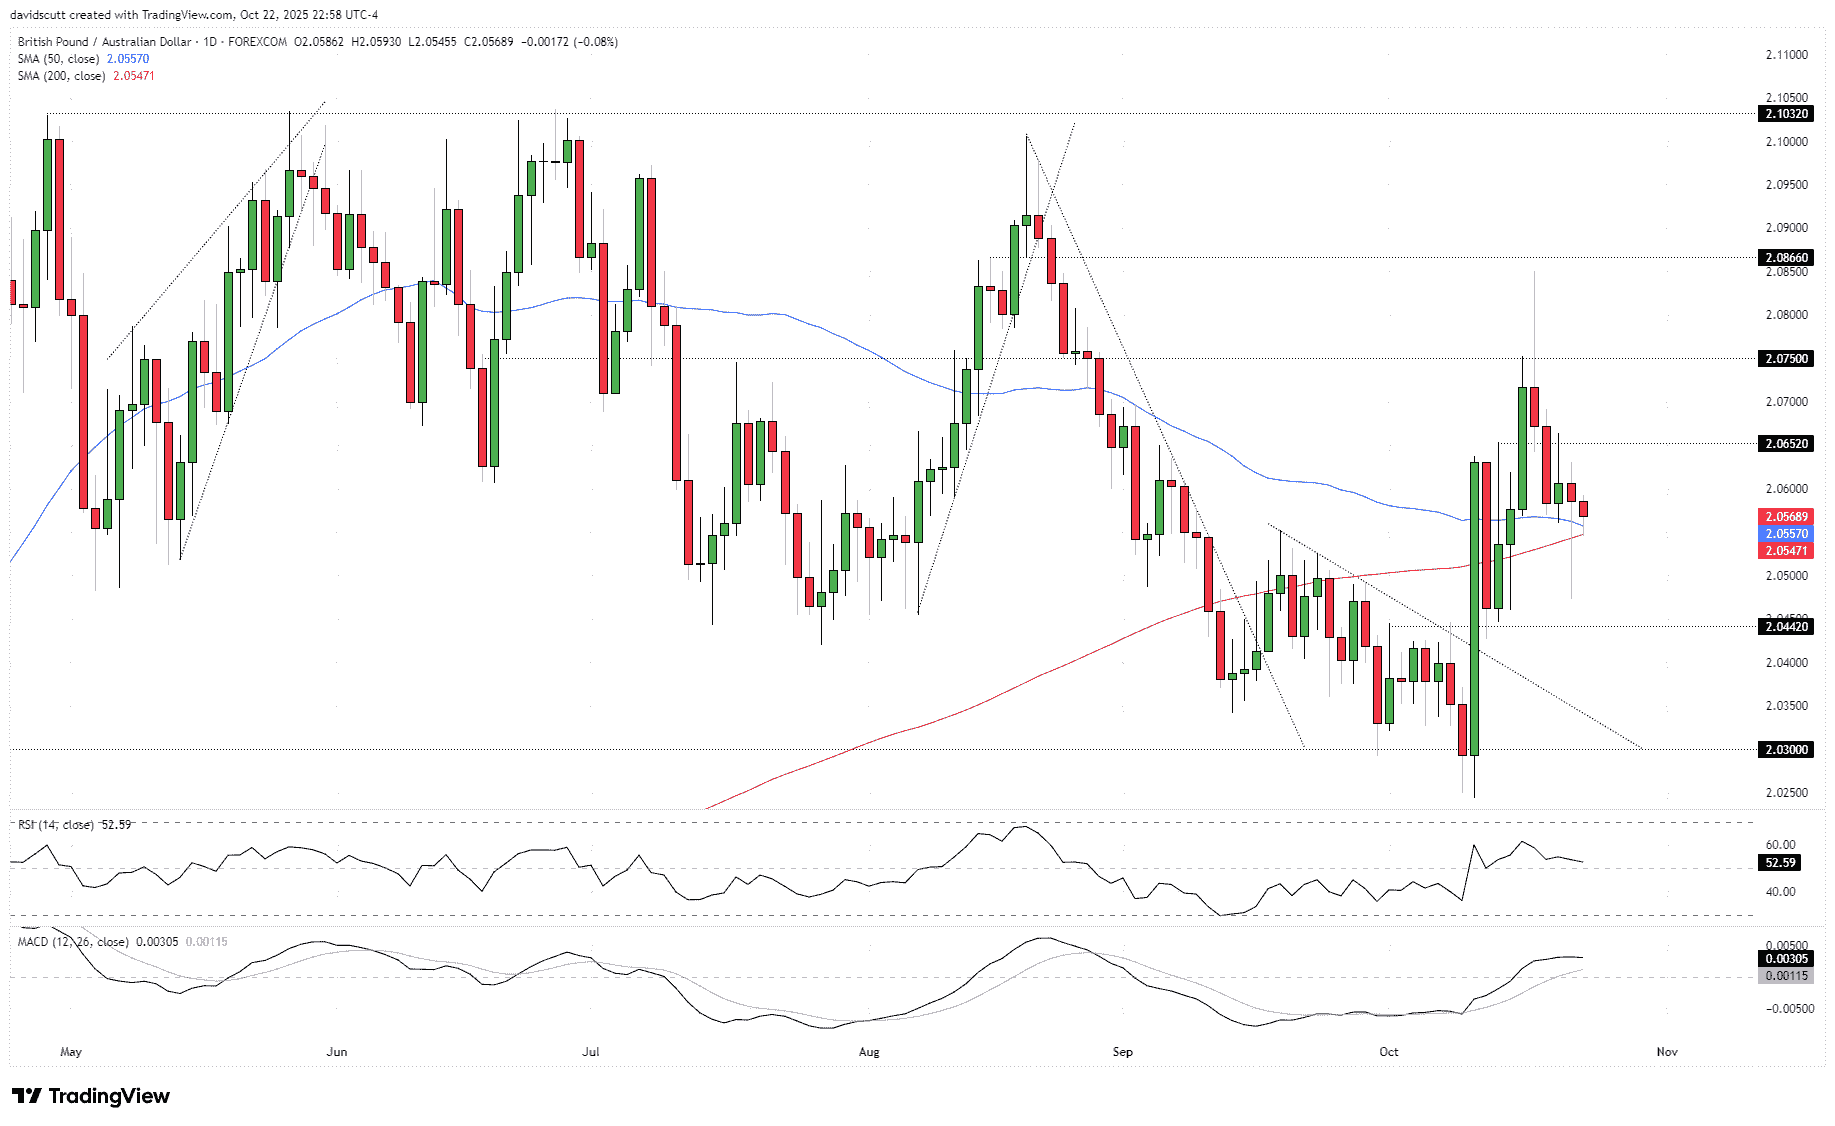
GBP/AUD has been slightly more exciting thanks to the large undershoot in the UK inflation report for September, released Wednesday. That sent Cable sharply lower and weakened the pound across most crosses. While the Aussie gained, the hammer candle that printed following a failed break below the 50 and 200-day moving averages shouldn’t be ignored—it’s a warning not to get too aggressive with shorts. It also hints that another failure to sustain a move below these levels could present a decent entry point for longs.
Above where the pair currently trades, 2.0652, 2.0750, and 2.0866 are levels of note. Below the 200DMA, 2.0442 and 2.0300 have seen plenty of price action recently, making them relevant should we see a deeper downside flush.
Momentum indicators show rapidly diminishing topside strength, but the combined message leans marginally bullish, slightly favoring upside over down.


Open an account in minutes
Experience award-winning platforms with fast and secure execution, and enjoy tight spreads from 0.5 pts on FX and 0.3 pts on indices.
Economic calendar
Web Trader platform
Our sophisticated web-based platform is packed with features.
Related articles
EUR/USD, GBP/USD Outlook: RSI Hits 2020 Oversold Levels
EUR/USD, GBP/USD Outlook: The EUR/USD daily RSI has fallen to oversold levels last seen in 2020, raising the risk of a reversal across correlated currency pairs, including the US dollar and GBP/USD.

Dow Jones forecast: Stock markets under pressure from multiple sources
When looking at the major tech-heavy US indices like the S&P 500 or the Nasdaq 100, you wouldn’t think that the stock market is particularly weak. Yet, beneath the surface, the market is far from healthy right now. Investors are evidently just piling into the big tech and AI names, and as a result, market breadth is deteriorating. Other indices like the small cap Russell 2000 and the Dow Jones are starting to reflect that weakness.


Tankan Backs BOJ Tightening, but Yen Rate Expectations Ease
Japan’s Tankan supports further BOJ tightening, although softer rate expectations could limit support for the Japanese yen.

This report is intended for general circulation only. It should not be construed as a recommendation, or an offer (or solicitation of an offer) to buy or sell any financial products. The information provided does not take into account your specific investment objectives, financial situation or particular needs. Before you act on any recommendation that may be contained in this report, independent advice ought to be sought from a financial adviser regarding the suitability of the investment product, taking into account your specific investment objectives, financial situation or particular needs.
StoneX Financial Pte. Ltd., may distribute reports produced by its respective foreign entities or affiliates within the StoneX group of companies or third parties pursuant to an arrangement under Regulation 32C of the Financial Advisers Regulations. Where the report is distributed to a person in Singapore who is not an accredited investor, expert investor or an institutional investor (as defined in the Securities Futures Act), StoneX Financial Pte. Ltd. accepts legal responsibility to such persons for the contents of the report only to the extent required by law. Singapore recipients should contact StoneX Financial Pte. Ltd. at 6826 9988 for matters arising from, or in connection with the report.
In the case of all other recipients of this report, to the extent permitted by applicable laws and regulations neither StoneX Financial Pte. Ltd. nor its associated companies will be responsible or liable for any loss or damage incurred arising out of, or in connection with, any use of the information contained in this report and all such liability is hereby expressly disclaimed. No representation or warranty is made, express or implied, that the content of this report is complete or accurate.
StoneX Financial Pte. Ltd. is not under any obligation to update this report.
Trading CFDs carries a high level of risk that may not be suitable for some investors. Consider your investment objectives, level of experience, financial resources, risk appetite and other relevant circumstances carefully. The possibility exists that you could lose some or all of your investments, including your initial deposits. If in doubt, please seek independent expert advice. Visit www.forex.com/en-sg/terms-and-policies for the complete Risk Disclosure Statement.